General Electric (GE) Heading Higher
Companies / Company Chart Analysis Nov 16, 2009 - 11:44 AM GMTBy: Mike_Paulenoff
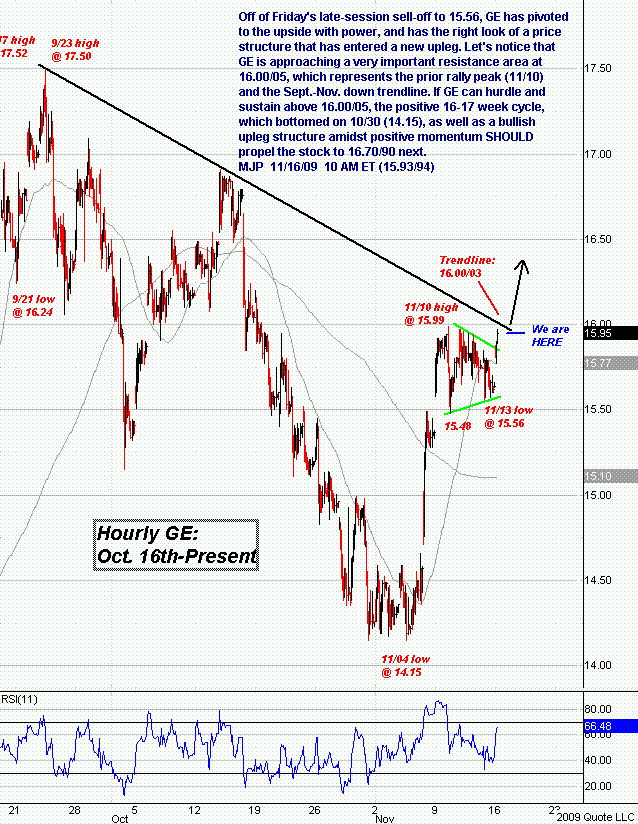
Off of Friday’s late-session sell-off to 15.56, General Electric (NYSE: GE) has pivoted to the upside with power and has the right look of a price structure that has entered a new upleg. Let’s notice that GE is approaching a very important resistance area at 16.00/05, which represents the prior rally peak (Nov 10) and the Sep-Nov down trendline.
If GE can hurdle and sustain above 16.00/05, the positive 16-17 week cycle (which bottomed on Oct 30 at 14.15) as well as a bullish upleg structure amidst positive momentum should propel the stock to 16.70/90 next.

Sign up for a free 15-day trial to Mike's ETF Trading Diary today.
By Mike Paulenoff
Mike Paulenoff is author of the MPTrader.com (www.mptrader.com) , a real-time diary of Mike Paulenoff's trading ideas and technical chart analysis of
Exchange Traded Funds (ETFs) that track equity indices, metals, energy commodities, currencies, Treasuries, and other markets. It is for traders with a 3-30 day time horizon, who use the service for guidance on both specific trades as well as general market direction
© 2002-2009 MPTrader.com, an AdviceTrade publication. All rights reserved. Any publication, distribution, retransmission or reproduction of information or data contained on this Web site without written consent from MPTrader is prohibited. See our disclaimer.
Mike Paulenoff Archive |
© 2005-2022 http://www.MarketOracle.co.uk - The Market Oracle is a FREE Daily Financial Markets Analysis & Forecasting online publication.


