Gold Short-term Overbought, Longterm Parabolic Bullish
Commodities / Gold & Silver 2009 Nov 15, 2009 - 10:51 AM GMTBy: Clive_Maund
 On longer-term charts gold looks great here as it accelerates away from its recently completed 20-month consolidation pattern. The prospect is for a powerful, steep multi-month advance, punctuated by mostly brief periods of consolidation. In the last update we examined the long-term charts to divine the big picture and as this has not changed since, we will in this update look at the shorter-term charts to consider the immediate outlook as gold is now overbought, and also pay attention to the dollar and euro, which are on the cusp of big moves that obviously have important implications for all markets.

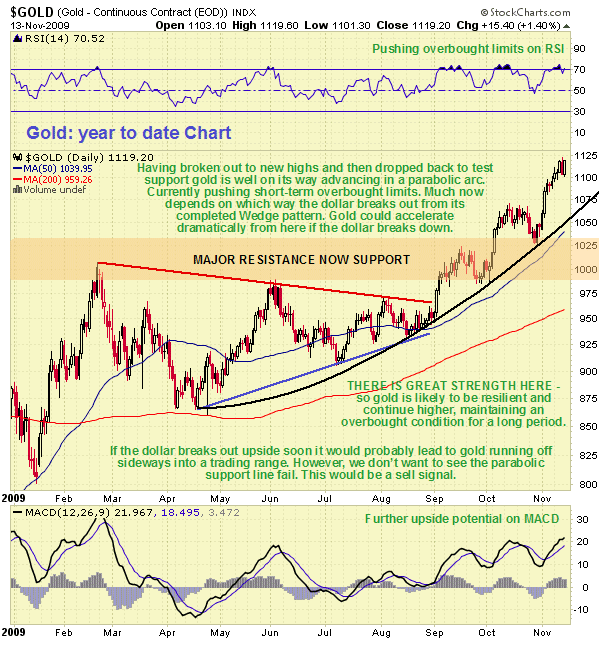
The year-to-date chart for gold looks extraordinarily bullish. It shows how gold is now accelerating away from the recently completed major consolidation pattern, with the early October breakout being followed by a classic test of support late in October. Since we are looking for - and expect to see - a parabolic acceleration away from the "gravitional pull" of the huge trading range, it is particularly satisfying to be able to draw a parabolic arc on this chart which already has three exact contacts.
This parabolic arc is clearly of the utmost importance - gold is an automatic buy on any contact with it, and failure of this arcing trendline will be a sell signal. Gold ran into a little bit of trouble late last week which was hardly surprising as it had become critically overbought on its RSI indicator shown at the top of the chart, however, there is still considerable room for it to advance further and continue to accelerate as made plain by the MACD indicator at the bottom of the chart, which is only moderately overbought. It is important here to point out that in the dynamic advancing phase, which gold is now in, it can BECOME OVERBOUGHT AND STAY OVERBOUGHT PERHAPS FOR MONTHS ON END, with minor reactions to ease overheating.

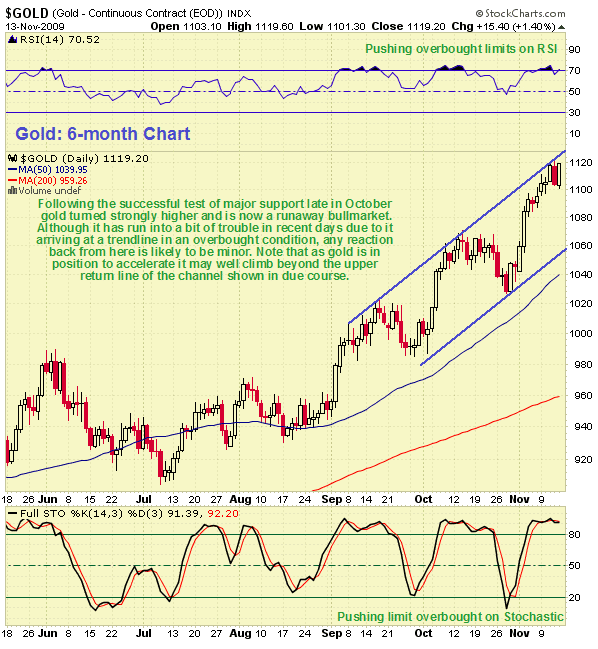
The 6-month chart makes clear why gold reacted back sharply last Thursday. It had arrived at the return line of the channel shown in a short-term critically overbought state, calling for consolidation/reaction to ease the overbought condition. However, Friday's robust recovery is a strongly bullish indication, so any further reaction is likely to be minor. The channel shown is provisional and given that gold has the potential to continue to accelerate, we should not be surprised to see it break above the top line of the channel shown in due course, once it is less overbought.

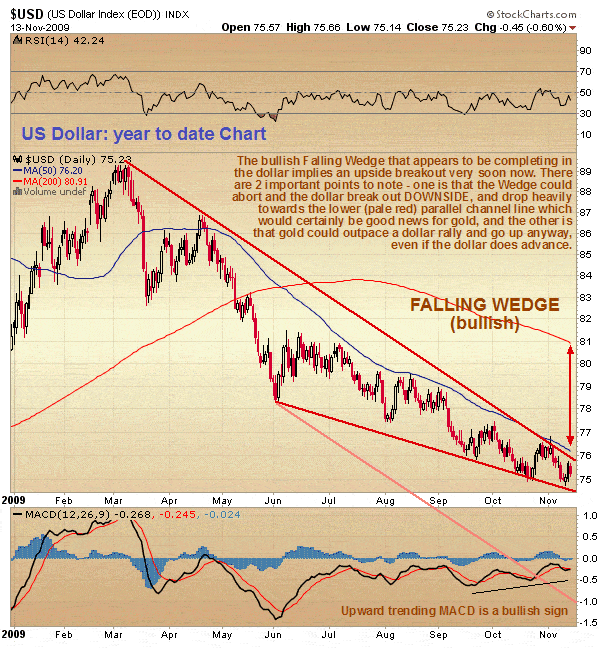
With the course of the dollar having major implications for gold and silver, and indeed all markets, it is timely for us to take look at it here, as it appears to be on the cusp of a big move. On the year-to-date chart for the dollar we can see that it is pushing towards the apex of a large Falling Wedge pattern. Normally Falling Wedge patterns are bullish but in the case of the dollar we do not have sufficient contacts with its boundary trendlines, particularly the top trendline, that we can be very sure of an upside breakout - it could BREAK DOWN instead and drop, possibly precipitously, towards the pale red parallel return line shown. If this happens we are looking at a massive drop that would stoke an enormous runup in gold, which as we have just seen, it is in position to make.
One thing is for sure though, and that is that the dollar is on the verge of a more rapid move than we have seen for many months. A situation like this, where it is very difficult to divine in advance the direction of breakout, is usually due to the market waiting on some completely unpredictable "black swan" event. Some gold bulls and goldbugs have understandably been rattled by the dire predictions of market forecasters like Karl Denninger and Ronald Rosen, who are in effect predicting a deflationary implosion, and soon. They may well be right if the "recovery" engineered by the powers that be via an orgy of manufactured liquidity and rock bottom interest rates is derailed by factors beyond their control, but it is very hard to determine if this will happen immediately, or in 6 months or in 2 years' time or at all - maybe the Asian tiger economies will ride to the rescue of the entire world. In the meantime, however, we could see a period of robust inflation that continues to drive up the price of gold and silver and many other commodities. We don't need to expend valuable cerebral energy trying to figure out the answer to this riddle ahead of time, however, because as pragmatic traders we simply continue to ride gold's parabolic uptrend, garnering huge profits along the way, and we only need to consider hitting the exits should it fail.
A tragic irony is that many Precious Metal stock investors will miss out on the developing huge rally in the sector, due to having been burned to a crisp during last year's meltdown, which has left them either wiped out or psychologically in no fit state to play the game. They are so spooked by the prospect of another broad market meltdown dragging everything down the hole that they are going to sit and watch the whole show from the sidelines, probably entering belatedly at much higher levels. Their fears are perfectly understandable - there could be another such meltdown, but the difference between them and us is that we are in the game and comfortable with it, because we have our predetermined point at which to hit the exits if the wheel comes off.

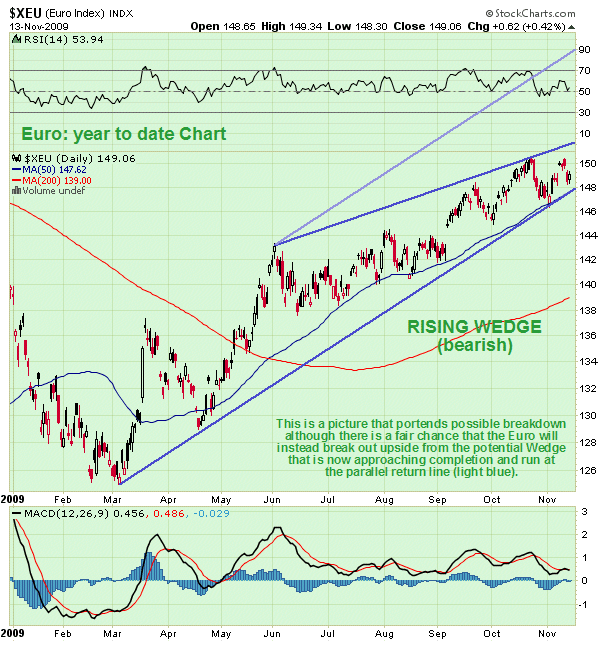
The dollar's Falling Wedge pattern is neatly reflected by the Rising Wedge pattern in the euro, which is precisely what we would expect to see. It has to be said that the euro does look like it is running out of puff on this chart. However, like the dollar, it could instead break out upside and run at the pale blue parallel return line shown.
Even if the dollar does break out upside and the euro to the downside, it does not automatically mean that gold and silver are going to get crushed, although it obviously doesn't help. In the changing world we live in we could find ourselves in a situation where the dollar and gold rally at the same time, in other words gold's rate of advance exceeds that of the dollar, so that it outruns it. Whatever the dollar does however we are clear - we can safely remain long gold whilst it remains above its parabolic uptrend line, only if it breaks below it will we need to consider evasive action.
By Clive Maund
CliveMaund.com
For billing & subscription questions: subscriptions@clivemaund.com
© 2009 Clive Maund - The above represents the opinion and analysis of Mr. Maund, based on data available to him, at the time of writing. Mr. Maunds opinions are his own, and are not a recommendation or an offer to buy or sell securities. No responsibility can be accepted for losses that may result as a consequence of trading on the basis of this analysis.
Mr. Maund is an independent analyst who receives no compensation of any kind from any groups, individuals or corporations mentioned in his reports. As trading and investing in any financial markets may involve serious risk of loss, Mr. Maund recommends that you consult with a qualified investment advisor, one licensed by appropriate regulatory agencies in your legal jurisdiction and do your own due diligence and research when making any kind of a transaction with financial ramifications.
Clive Maund Archive |
© 2005-2022 http://www.MarketOracle.co.uk - The Market Oracle is a FREE Daily Financial Markets Analysis & Forecasting online publication.


