


Stock Market Smart Money Turning Bearish
Stock-Markets / Stock Market Sentiment Nov 15, 2009 - 10:31 AM GMTBy: Guy_Lerner

 After 15 weeks of being neutral, the "smart money" indicator has turned towards a more bearish reading. The "dumb money" indicator remains in the extreme bullish zone. While not there yet, the indicators are heading in the direction that one would expect to see at a market top.
For now, I will continue to state what I have been stating for 5 weeks as it has served us well in defining the price action seen in the major market indices:
"Equities are for renting not owning at this juncture. I am not calling for a market top, but prices should trade more in a range, and if you intend to play on the long side, it will be important to maintain your discipline (for risk reasons) and buy at the lows of that trading range and sell at the highs to extract any profits from this market. The upward bias still remains as long as investor sentiment is still extremely bullish, but there is probably greater risk of a market down draft now than in past weeks."
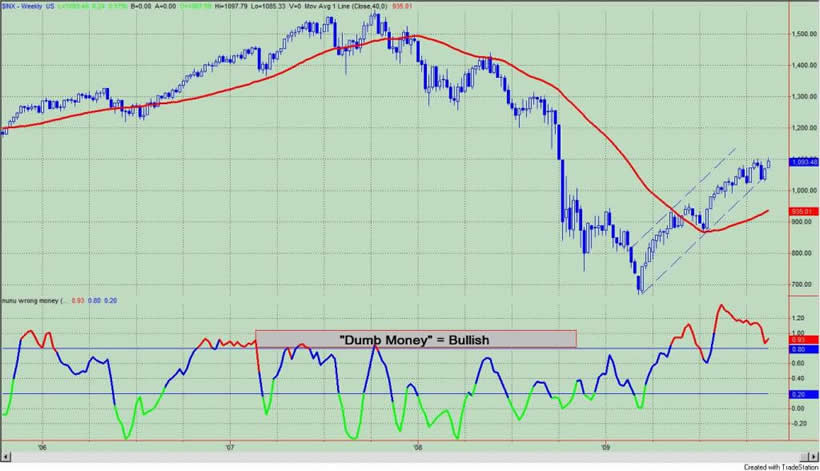
The "Dumb Money" indicator, which is shown in figure 1, looks for extremes in the data from 4 different groups of investors who historically have been wrong on the market: 1) Investor Intelligence; 2) Market Vane; 3) American Association of Individual Investors; and 4) the put call ratio. The "Dumb Money" indicator shows that investors are extremely bullish.
Figure 1. "Dumb Money" Indicator/ weekly
The "Smart Money" indicator is shown in figure 2. The "smart money" indicator is a composite of the following data: 1) public to specialist short ratio; 2) specialist short to total short ratio; 3) SP100 option traders. The "smart money" has dropped below the neutral line for the first time in 15 weeks. During this time, the S&P500 gained about 10%.
Figure 2. "Smart Money" Indicator/ weekly
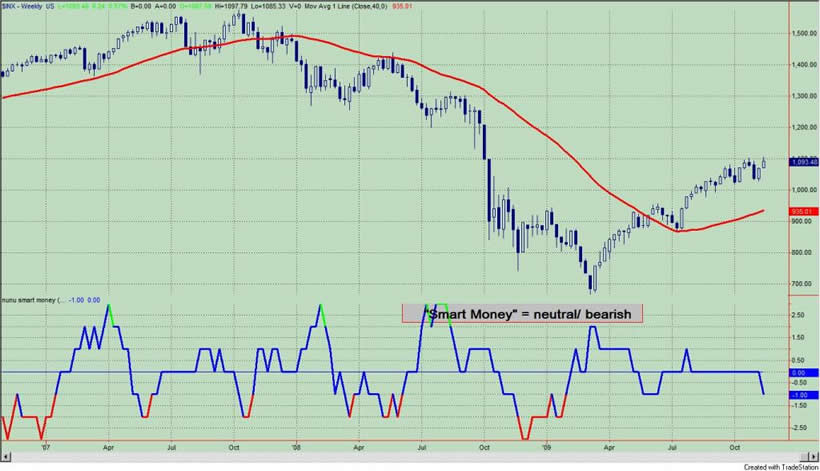
Figure 3 is a weekly chart of the S&P500 with the InsiderScore "entire market" value in the lower panel. There is nothing noteworthy about the indicator value, and from the InsiderScore weekly report we get the following two insights: 1) companies with selling outnumbering companies with buying by a 2-to-1 margin; and 2) insiders - as they've done since early June - showed a distinct interest in selling.
Figure 3. InsiderScore Entire Market/ weekly
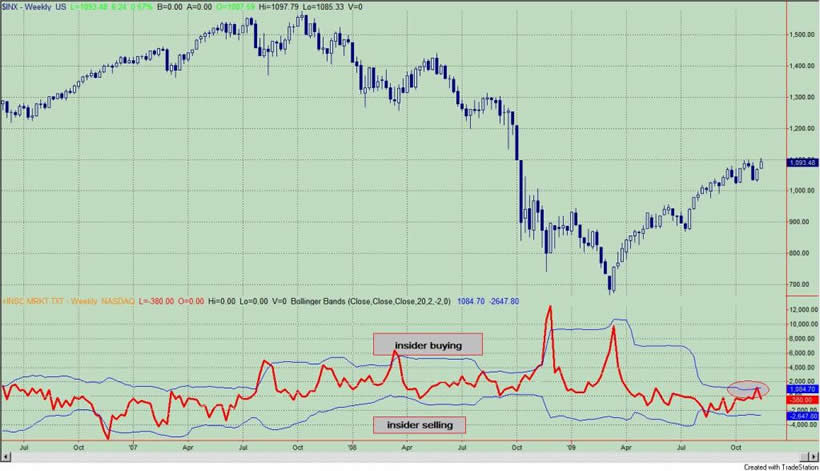
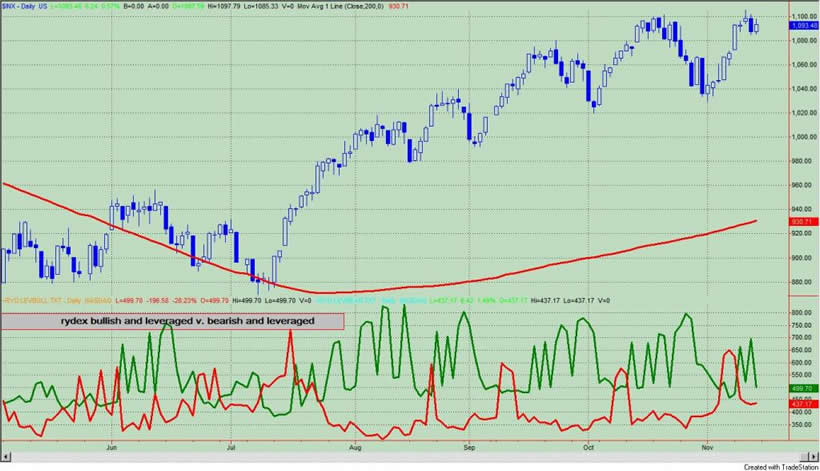
Figure 4 is a daily chart of the S&P500 with the amount of assets in the Rydex bullish and leveraged funds versus the amount of assets in the leveraged and bearish funds. Not only do we get to see what direction these market timers think the market will go, but we also get to see how much conviction (i.e., leverage) they have in their beliefs. Typically, we want to bet against the Rydex market timer even though they only represent a small sample of the overall market. As of Friday's close, the assets in the bullish and leveraged funds were greater by a slight amount than the bearish and leveraged; referring to figure 4, this would put the green line greater than red line. Essentially, there is no real edge with regards to this short term data set.
Figure 4. Rydex Bullish and Leveraged v. Bearish and Leveraged/ daily
Considering the sentiment picture on its own, we can sum up by asking one question: is this the market environment that will take you from here to there? I believe that answer is "no". Markets can always go higher confounding the pundits, but the high odds play according to the sentiment data is that the major equity indices are in a topping process. This implies a trading range at best. There is risk of a down draft as markets "fueled" by the proverbial "liquidity" are prone to quick sell offs. The outlier trade is a market blow off or a spike in prices, and I do not rule this possibility out because of the ongoing downtrend in the Dollar Index. It is possible but it is not the high odds play.
By Guy Lerner
http://thetechnicaltakedotcom.blogspot.com/
Guy M. Lerner, MD is the founder of ARL Advisers, LLC and managing partner of ARL Investment Partners, L.P. Dr. Lerner utilizes a research driven approach to determine those factors which lead to sustainable moves in the markets. He has developed many proprietary tools and trading models in his quest to outperform. Over the past four years, Lerner has shared his innovative approach with the readers of RealMoney.com and TheStreet.com as a featured columnist. He has been a regular guest on the Money Man Radio Show, DEX-TV, routinely published in the some of the most widely-read financial publications and has been a marquee speaker at financial seminars around the world.
© 2009 Copyright Guy Lerner - All Rights Reserved
Disclaimer: The above is a matter of opinion provided for general information purposes only and is not intended as investment advice. Information and analysis above are derived from sources and utilising methods believed to be reliable, but we cannot accept responsibility for any losses you may incur as a result of this analysis. Individuals should consult with their personal financial advisors.
Guy Lerner Archive |
© 2005-2022 http://www.MarketOracle.co.uk - The Market Oracle is a FREE Daily Financial Markets Analysis & Forecasting online publication.