If This is Economic Recovery, Where Are the Increased Tax Revenues?
Economics / Recession 2008 - 2010 Nov 14, 2009 - 01:26 PM GMTBy: John_Mauldin
 If This is Recovery, Where Are the Taxes?
Last Business Standing
Stimulus, What Stimulus?
The Reality of Unemployment
Let the Good Times Roll
The Quick Double-Dip Scenario
No one goes into Wal-Mart and asks to pay extra sales tax. Thus sales taxes are reasonable barometers for retail sales. This week we look at how taxes are doing in a period of economic recovery. Then we turn our eyes to a very interesting (and sobering) analysis of possible future unemployment rates. This is an anecdote to the happy-face analysis of employment numbers you get from establishment economists. There will be a lot of charts and tables, so this letter may print a little longer, but I think you will find it very interesting.
If This is Recovery, Where Are the Taxes?
I keep reading about surveys that show that retail sales are up. But as noted above, no one pays extra sales taxes, or decides they need to pay more income taxes. The surest way to measure retail sales is sales taxes. Want to know how incomes are doing? Look at income tax receipts. Let's look at sales taxes first.
First off, I can find no single source of recent sales tax information. It is all one-off, but it is consistent. Sales taxes in my home state of Texas are down 12.8% year-over-year, and we're in the fifth straight month of decreases of 11% or more. Projections are for sales taxes to continue to decline into 2010.
There is a very revealing study by the Pew Center on state taxes, called "Beyond California" (http://www.pewcenteronthestates.org/). Everyone knows how bad California is. The Pew Center looks at how the rest of the states are doing, and focuses on 10 states that also have severe problems. Sales tax receipts are down 14% in Arizona, and state income taxes are down 32%.
On average, revenues are down almost 12%. Oregon has seen their revenues collapse a stunning 19%. New York is down 17%, with a deficit of 32%. Illinois has a projected deficit of 47% of its budget, second only to California with 49%. You can see how your state fares at http://downloads.pewcenteronthestates.org/Beyond_California_Appendix.pdf.
The Liscio Report notes that all states had negative year-over-year sales tax collections in October, and the weighted average decrease was 10.2%, down from a negative 7.2% in September. (www.theliscioreport.com)
Sales at Wal-Mart stores slipped by 0.4% in the third quarter. Actual government figures show that retail sales were down 1.5% in September from the previous month and 5.8% year-over-year. So how do we keep seeing headlines about retail sales being up, as unemployment keeps rising?
Remember that such reports are usually based on surveys, and generally cover mid-sized and up retailers, leaving out smaller businesses. Further, if you are a retail chain that has closed 10% of its stores, the remaining stores should in theory benefit from getting your loyal customers into them.
Last Business Standing
Yesterday I was with an associate, and I hesitated in asking them how their business was doing, because I knew things had been tough at the beginning of the year. But I did ask, and they said sales were up over the last months and business was looking better. Surprised, I asked them what made the difference. "Ah," they said, "less competition. Our competitors have gone out of business."
Best Buy and other electronic retailers had to benefit from Circuit City disappearing. That is Schumpeter's creative destruction at work. Not very good for total employment, but it does help the profitability of the survivors.
So, if things are so bad, how did we have 3.5% growth in the third quarter? First off, things are not as bad as they were in the past year. We are in fact getting close to an economic bottom, at least for now. Second, the 3.5% number is a preliminary estimate. A study by Goldman Sachs suggests that the number will be revised down by at least 0.5% and maybe as much as 1%.
Why? The estimate does not really take into account how poorly small businesses are performing. If you look at small-business indexes and compare them to historical GDP numbers, you get the smaller number mentioned above. And since at least 2% of the GDP was from the stimulus package (Cash for Clunkers, houses, tax cuts), the economy on its own was flat. That begs the question, what happens when the stimulus runs out?
And the answer is that we won't know for some time, as the stimulus is just getting ramped up. "According to CBO estimates, only 21% of [the stimulus] spending will occur in 2009; another 38% will come in 2010, and 22% in 2011. After that, its effect will dissipate quickly." (The Liscio Report)
But David Rosenberg notes that what the federal government is giving, the states are taking away. The Pew Study shows that at least nine other states are in appalling shape, so it is no wonder that David writes:
Stimulus, What Stimulus?
"Fully nine states are in fiscal distress and only two have balanced budgets. States like Michigan are planning 20% budget cuts for the coming year. Indiana is planning a 10% spending cut in light of a 7.4% YoY revenue decline. How can the economy really be out of recession if government revenues are still deflating?
"The states are filling around 40% of their fiscal gaps with the federal stimulus (so much for spending on "shovel ready" infrastructure projects). Even after the fiscal help from Washington, the state governments will still face a projected deficit of $142 billion for 2011 (versus $113 billion in 2010). All in, the restraint in the state and local government sector is estimated to drain a full percentage point from U.S. GDP growth in 2010 and more than fully offset the stimulative efforts from Washington. The U.S. economy is more likely to post growth of little more than 2% next year, rather than the 5% currently being discounted by the equity market."
The Reality of Unemployment
All this is, of course, going to put continued pressure on employment. As I noted last week, the number of unemployed actually soared by 558,000, to 15.7 million, as measured by the household survey, not the 190,000 you read about in the mainstream media. Unemployment is sadly continuing to rise by significant amounts.
In August, I did an interview with CNBC from Leen's Fishing Lodge in Maine. The unemployment numbers had just come out. I did a back-of-the-napkin estimate that we would need about 15 million new jobs over the next five years just to get back to where we were when the recession started.
That works out to a need for about 125,000 new jobs each month to handle new workers coming into the market (which comes to a total of 7.5 million over five years), plus the 8 million and rising jobs we've lost. That is a daunting number. It amounts to 250,000 new jobs a month every month for five years. And we are still losing more than that number a month, let alone adding the needed 250,000.
Look at the chart below. It shows the establishment survey employment figures for the last ten years. Only once, in 1999, did we actually add over 250,000 jobs a month for a whole year. And that was during the internet boom.
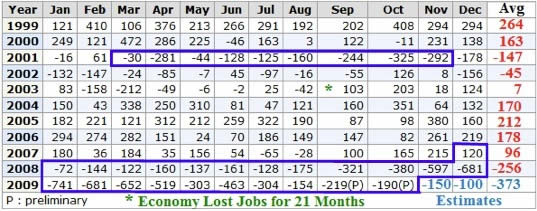
Sadly, the private sector has shed over 300,000 jobs since 1999. Think about that. We have had a decade where there have been no new jobs added by the private sector. Real incomes are roughly where they were, and the stock market is down. Talk about a lost decade.
I love it when someone does the really heavy lifting for me, and my friend Mike Shedlock of Sitka Pacific Capital Management has done a wonderful job of taking that speculation of mine and putting it into a spreadsheet that helps us get a real handle on what unemployment is likely to look like for the next ten years. I am going to make use of his basic analysis and then modify some of his assumptions in the spreadsheet he provided me, in order to think about different scenarios.
All three scenarios are based on assumptions, so let's see what Mish started with. There is a wealth of data available from the Bureau of Labor Statistics and the Census Bureau. According to the Census Bureau Population Estimates we are going to add about 2.5 million working-age (16 years old and up) citizens a year, from now until 2020. The numbers varies slightly year to year. Mish used an estimate of the average, summing up the buckets from 16 to 100+ for the years in question and rounding the result.
You can go to the BLS site and look at Table A-1, which shows the civilian noninstitutional population (those over 16 not in prisons), the participation rate (those who are working and/or want to work), the unemployment rate, the number employed, those not in the labor force, and those who want a job. Those are starting numbers for the charts below.
For those interested, you can read Mish's very full (and quite detailed) analysis at his blog site http://globaleconomicanalysis.blogspot.com/..). But let's look at his assumptions:
- Job losses are likely to continue for a minimum of another year.
- When job gains start, they will be very slow at first, then pick up.
- An extremely generous monthly job gain stat over the course of the year would be 150,000 jobs.
- A falling participation rate (boomers retiring) will continue to mask reported unemployment.
- Starting in 2013 the labor pool will start decreasing because of Boomer demographics.
- The noninstitutional population will rise by 2.5 million workers a year.
The spreadsheet below needs a little explanation. Let's start with the assumptions. Mike starts with current working-age population and adds 2.5 million people a year. He assumes that Boomers will retire at 65 (something which all the surveys say is not going to happen). And his last estimate is what the unemployment numbers will be. Everything else is based on those assumptions, which leads to the first column, or the expected unemployment number.
By the way, we know that everyone will want to make different assumptions. I am going to create three scenarios, but you can go to Mike's blog and at the bottom of the post is a link to the actual spreadsheet. Have fun. Let's look at scenario 1.
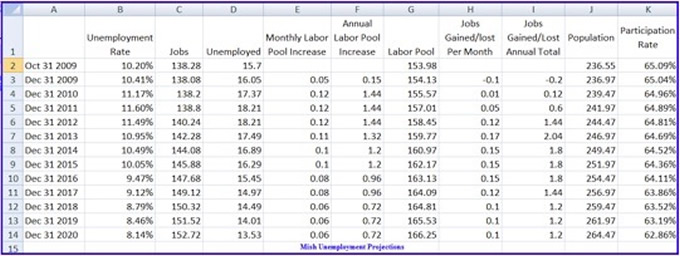
This assumes there is no double-dip recession, and jobs roughly rise along the same lines as the last recovery. Actually, Mish is far more optimistic, as in the very first chart you will notice that job losses were negative in the first year after the end of the recession and flat the second year. Mish has jobs rising by 120,000 next year and 600,000 the second year (2011), and then a fairly robust recovery. Below is the graph of the unemployment numbers under such a scenario.
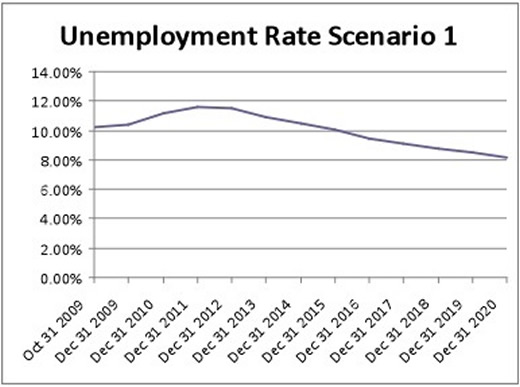
Notice that unemployment stays at or above 11% for three years. Pessimistic? Mainstream and usually very optimistic Mark Zandi of www.economy.com predicted this week that unemployment would rise to 11% by the middle of next year, right in line with this scenario. Also note that total jobs rise by 14 million over ten years. Hardly doom and gloom. Again, Boomers all retire on time and there is no double-dip recession.
Let the Good Times Roll
What would it take to get back to 5% unemployment? I played with the spreadsheet and came up with the following numbers, which get us below 5% by 2020. I assume no recessions for the next ten years, and 2 million new jobs a year after 2011, which I start off with almost 1.5 million jobs. Of course, we have never done that, but let's be optimistic.
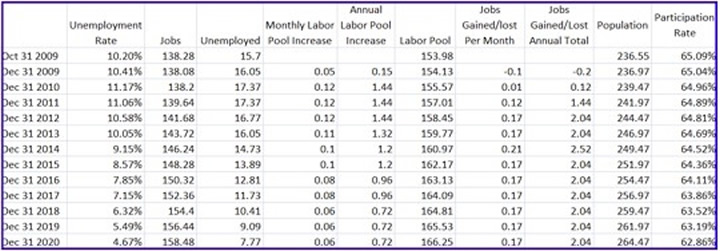
And the graph below shows the unemployment numbers for the Good Times Scenario.
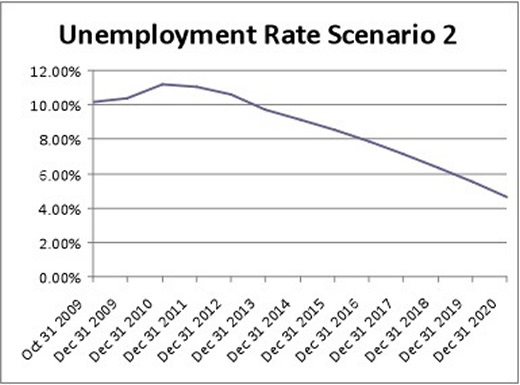
Want to get to 5% within five years? Add 3 million jobs a year starting now. With no housing recovery, a smaller auto industry, and financial firms getting leaner.
The Quick Double-Dip Scenario
When I called the last two recessions about a year before they happened, it was not all that hard. We had inverted yield curves, falling leading indicators, and a lot of other data that pretty much pointed to a recession. Believing that we had a housing bubble and a looming credit crisis also helped my conviction in calling the last recession.
I think we are in for a double-dip recession in 2011, yet I readily admit there will be little if any statistical evidence in advance this time. This is more of an instinct call. I have serious doubts that we can have what amounts to the largest tax increase of all time in what will be a very weak (albeit growing) economy, without putting us back into recession. And Speaker Pelosi thinks it is a smart thing to add another 5.4% surtax on what will already be a rising capital gains and dividend tax.
Taxing small businesses, and that is what the tax increase amounts to, is a very bad idea in a weak economy. Small businesses are where the job growth comes from. Taking money from productive businesses and giving it to government is a fundamentally flawed concept.
Now, if they decide to postpone the tax increase, or phase it in slowly, then maybe we avoid the double dip. But right now it doesn't look like that will be the case. So, let's quickly see what a double-dip scenario might look like. Let's be optimistic and assume we only lose another 1.2 million jobs in the next recession, since we have already lost so many in this one (8 million and counting). And then the economy comes roaring back in 2012 with 1.5 million jobs and continues to grow rather smartly for the rest of the decade. No further recession. We absorb the tax increases and move on with our economic lives.
Unemployment under such a scenario would rise to just under 13% and stay above 10% for 8 years. Take a look at the chart and graph.
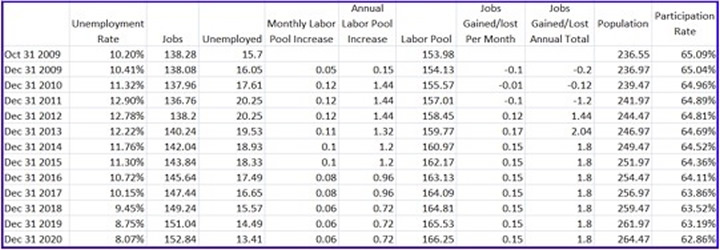
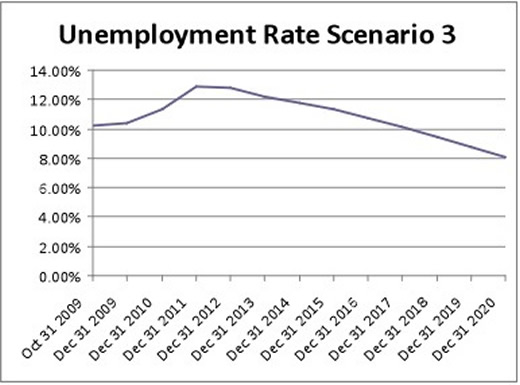
Think 13% is too dire? This week David Rosenberg said unemployment would rise to between 12-13%. The former Merrill Lynch economist was one of the few mainstream economists who called the recession and the credit crisis. The so-called "Blue Chip" economists told us at the beginning of 2008 that unemployment would peak out at 6%. While Rosie is not optimistic of late, he has a rather solid record of being right.
We are at 10.2% unemployment today. The economy lost jobs for 21 months after the end of the last recession. That would easily take us into 2011. Another million lost jobs will take us well over 11% and close to 12% (remember, you have to add in the increasing population), even without my double-dip scenario.
The letter is getting long and it's getting late, so let me close with a few thoughts.
First, 12% unemployment is horrendous by American standards. But Spain is now at 20%, and much of Europe has been in the 10% range for years.
Second, Americans are not used to the concept of 12% unemployment or 10% rates for extended periods. That is going to cause a serious backlash across the political spectrum. Couple that with the discomfort over $1.5-trillion deficits and there could be some serious political changes in the coming years. I think the message will be more anti-incumbent than one party or the other.
Third, the only way out of this morass is to create an environment where small business can thrive. As I've noted for the last several weeks in this letter, government spending does not increase GDP over time. It is a temporary nonproductive stimulus. It takes private investment to create jobs and increase productivity. Over the next few months, I will write more about how to do that.
Phoenix, New York, and Thoughts on the Internet
Next week I take a quick one-day trip to Phoenix, then back to do a satellite-remote speech to a South African hedge fund conference. I will be in New York the first weekend of December (the 4th) for Festivus, a great fundraiser for kids sponsored by Todd Harrison and the team at Minyanville (http://www.rpfoundation.org). Interestingly, they hold it every year at a "Texas" barbecue joint. Look me up if you are there.
The 7 kids, spouses, and grandkids are starting to gather. We will all have brunch Sunday and then a shower for Tiffani. She has another 6 weeks before she is due, and she is really uncomfortable. Walking is literally a pain.
Permit me to reminisce. A little over 9 years ago I started this letter on the internet with about 2,000 email addresses. It was a new version of what had been a print letter, as that was the business I knew. The internet was still a new thing to me, but it seemed like a good idea at the time. Little did I know.
I am still amazed at the growth and the direction my business and life have taken. My letters are sent out by various publishers and affiliates to over 1.5 million readers and posted on dozens of web sites, and the numbers have been growing rapidly of late. I am grateful. But I wonder what would happen if I started it today. Ten years ago there was little in the way of free economic letters. Not a lot of competition.
Today, there is so much free information that it's staggering. There have to be thousands of blogs and hundreds of free letters, some with very large circulations. It seems a new star is born every few months. While much of it does not add to the level of conversation, some of it is quite excellent. I think I am lucky to have started when I did.
And I am grateful for the kind attention you give me. As I turn 60, I note that this has been a rather overwhelming last ten years. A lot of changes for me, and almost all of them very good. But there are more to come. The last two flights I was on I was connected to the internet at 35,000 feet. I sense a lot more changes coming. I am thinking a lot about how to keep up and not get left behind, how to make sure that you, gentle reader, continue to get my best. That is what, at the end of the day, drives me.
Have a great week. I know I shall. Dad loves it when his kids (from 15 to 32) and spouses and grandkids are all under one roof.
Your amazed at it all analyst,
Your always optimistic at the beginning of the season analyst,
By John Mauldin
John Mauldin, Best-Selling author and recognized financial expert, is also editor of the free Thoughts From the Frontline that goes to over 1 million readers each week. For more information on John or his FREE weekly economic letter go to: http://www.frontlinethoughts.com/learnmore
To subscribe to John Mauldin's E-Letter please click here:http://www.frontlinethoughts.com/subscribe.asp
Copyright 2008 John Mauldin. All Rights Reserved
John Mauldin is president of Millennium Wave Advisors, LLC, a registered investment advisor. All material presented herein is believed to be reliable but we cannot attest to its accuracy. Investment recommendations may change and readers are urged to check with their investment counselors before making any investment decisions. Opinions expressed in these reports may change without prior notice. John Mauldin and/or the staff at Millennium Wave Advisors, LLC may or may not have investments in any funds cited above. Mauldin can be reached at 800-829-7273.
Disclaimer PAST RESULTS ARE NOT INDICATIVE OF FUTURE RESULTS. THERE IS RISK OF LOSS AS WELL AS THE OPPORTUNITY FOR GAIN WHEN INVESTING IN MANAGED FUNDS. WHEN CONSIDERING ALTERNATIVE INVESTMENTS, INCLUDING HEDGE FUNDS, YOU SHOULD CONSIDER VARIOUS RISKS INCLUDING THE FACT THAT SOME PRODUCTS: OFTEN ENGAGE IN LEVERAGING AND OTHER SPECULATIVE INVESTMENT PRACTICES THAT MAY INCREASE THE RISK OF INVESTMENT LOSS, CAN BE ILLIQUID, ARE NOT REQUIRED TO PROVIDE PERIODIC PRICING OR VALUATION INFORMATION TO INVESTORS, MAY INVOLVE COMPLEX TAX STRUCTURES AND DELAYS IN DISTRIBUTING IMPORTANT TAX INFORMATION, ARE NOT SUBJECT TO THE SAME REGULATORY REQUIREMENTS AS MUTUAL FUNDS, OFTEN CHARGE HIGH FEES, AND IN MANY CASES THE UNDERLYING INVESTMENTS ARE NOT TRANSPARENT AND ARE KNOWN ONLY TO THE INVESTMENT MANAGER.
© 2005-2022 http://www.MarketOracle.co.uk - The Market Oracle is a FREE Daily Financial Markets Analysis & Forecasting online publication.


