Stock Market S&P500 Knocking at the 1100-1007 Door
Stock-Markets / Stock Index Trading Nov 14, 2009 - 01:08 PM GMTBy: Piazzi
 We expected a bounce, and we got a bounce, but, looking at a larger frame, what I see is that despite all the drama and the angst, S&P has done absolutely nothing for weeks
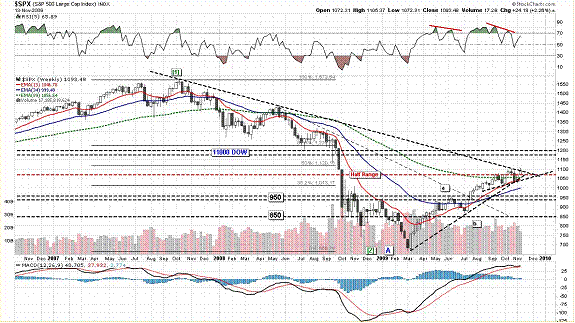
It was quite some time ago that I did the above chart with the half range marker, and market has just found some balance around that. It can probably squeeze a couple of more weeks into the wedge point shaped between the 2007 downtrend and the current uptrend lines. It soon has to make up its mind. It is running out of technical space.
If it breaks up, it will be in a very good technical setup, enjoying a multitude of support, especially from its 89 WEMA. That can give the index enough of a base to consolidate in the 1100-1200 range. If it breaks down, judging from the nervousness that surfaces anytime index approaches 1100 these days, it may be set on a quick drop to 950-1000 area.
Notice that there is a 50% retracement around 1120. The reason I bring this up is because I hear and read it everywhere nowadays. If you go back to 2004-2005, you’ll see that 1120 was the mid-level of a wide and long area of consolidation. Since everybody expects something drastic to happen at 1120, I think if index breaks above the 1107 pivots, it will either overshoot 1120 or falls short of it. And if index manages to hold 1100-1107 after the breakout, 1120 may, once again play the half range marker for a consolidation range. Just thinking scenarios and predicting anything
There is a consolidation zone on NDX as well
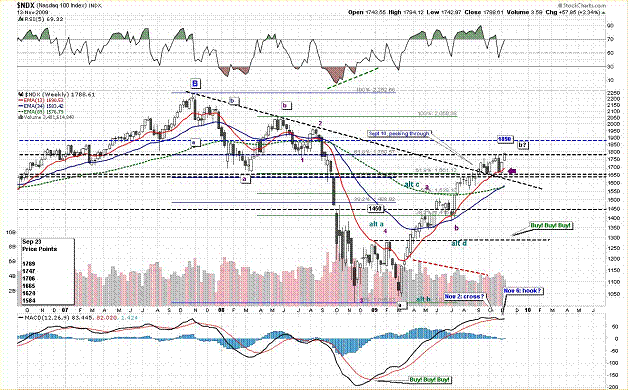
In September, I calculated a set of theoretical price points for NDX. Amazingly, those price points formed a box that has so far contained the price activity of index. This week, NDX tried to poke through to the upside but was held in place. Notice the amount of support afforded the index by its rising moving averages. Notice that the index has held the breakout to the upside of downtrend line from the 2007 top. And notice that the top and the bottom of the box are very important technical levels from 2008. As long as NDX stays in the box, it offers very objective trades for fast and disciplined traders. Mind you, the box is 10-week old, and may have become a bit too known and weak for its own good.
For NDX, a successful break to the upside can send the index a quick 50 points up before another long tern level of resistance is met.
A break below the box will not bode well for the index.
For the less adventurous, inside the box is a chop zone that can hack away at precious capital, and that’s one thing consolidations do – they retire as much capital and as many players as possible.
On both indexes, notice the shape of MACD. It seems like a hook is forming. If so, it will be very supportive of any upside breakouts in coming days.
Nobody knows the future (The delusional and the prophets excluded, of course). We can lay out scenarios and anticipate but we need to be flexible to shed our persuasions and adapt when market betrays our expectations.
For the day, volume was below average. Breadth was good
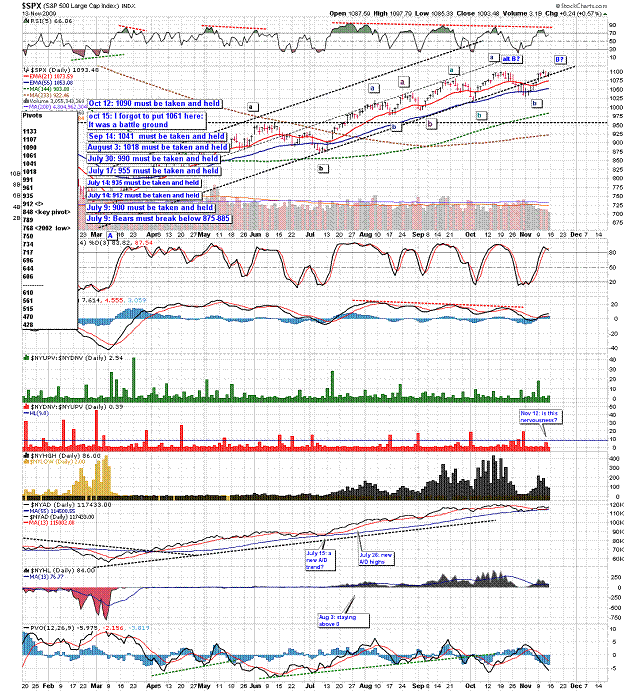
Whatever happened to volume? Where does the active money play, if not in equities?
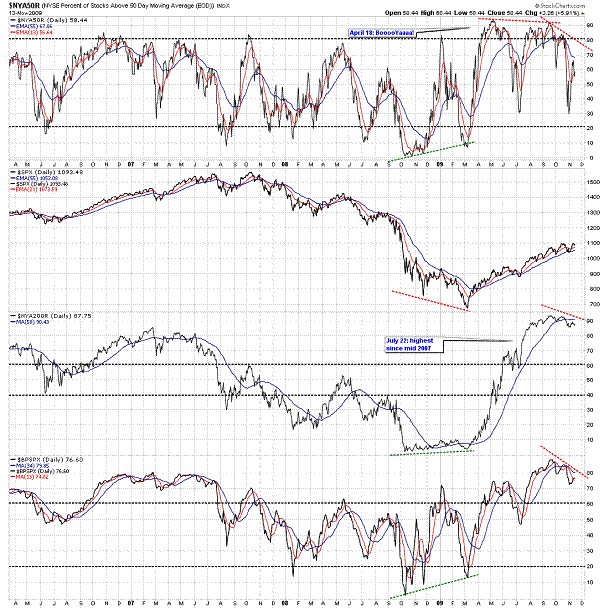
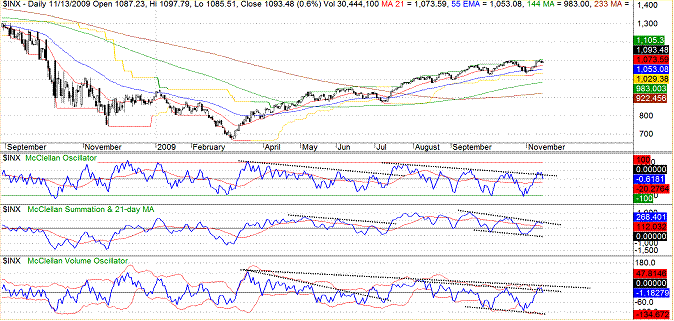
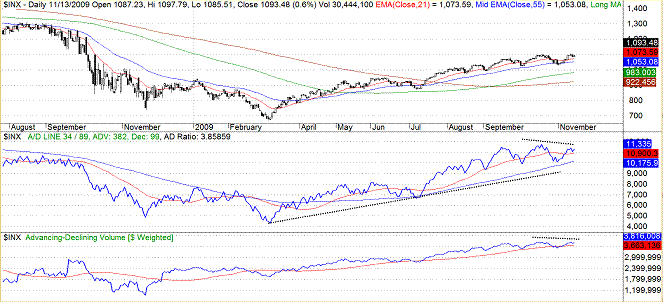
Internally, some short to mid-term indicators of market breadth are showing some dour divergences from price.
Daily momentum cycle has turned up, but it is diverging, and if it fails to better the last momentum cycle peak, it will denote a serious momentum swing failure.
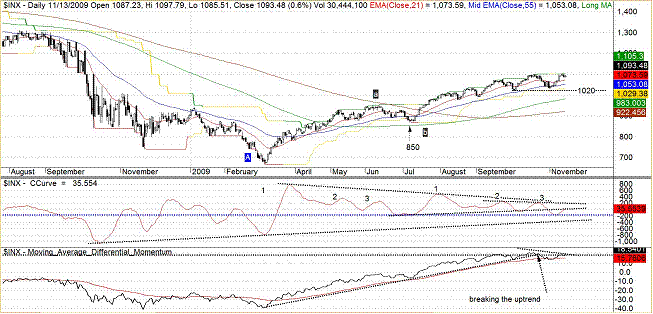
It may be a serious sign of caution if index breakouts to the upside but we do not get a renewed momentum cycle with uptrending peaks and valleys.
The mid-cap index RUT has so far not been able to recover in pace with the large cap indexes
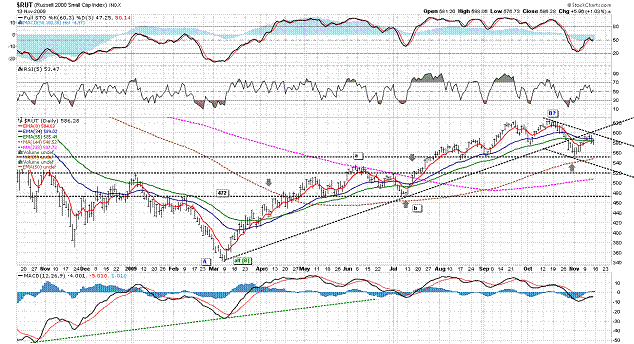
But money’s cheap, very cheap
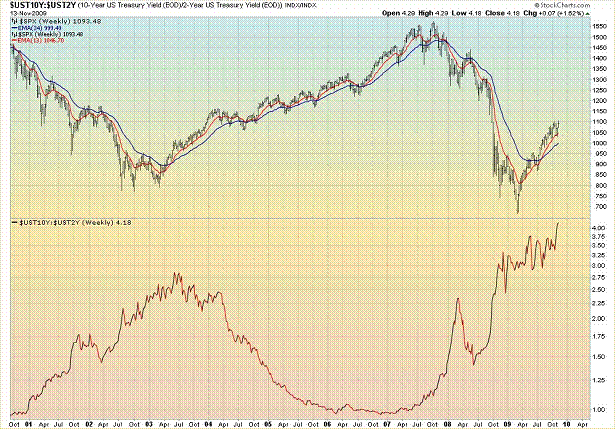
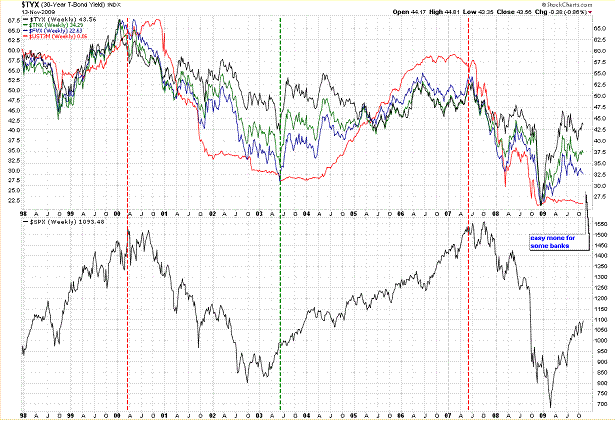
Yes, money’s cheap if you can get it at source. And not everyone has access to the source, so, maybe that’s one reason why the volume is low.
Volume will eventually come. If it comes and persists on the upside, it may be viewed as a vote of confidence in the general uptrend of equity markets. If it comes and persists on the downside, it may open some flood gates. It may be that many are just waiting for the resolution of the consolidation period discussed above on the weekly charts of S&P and NDX.
So we have some non-confirmations and some negative divergences. But who know? We have seen a number of times since March that some areas of the market can hold firm long enough for the rest to finish their corrections and join the party. Tech sector held admirably well during June-July period. Maybe it is now the large caps of S&P and the DOW that are carrying the load for the juniors to catch up.
It ain’t broken until it’s broken and picking a top (or bottom for that matter) can be a hazardous endeavor.
Last week, S&P tried, and failed to capture the 1100 level that seems to be the focus of attention these days
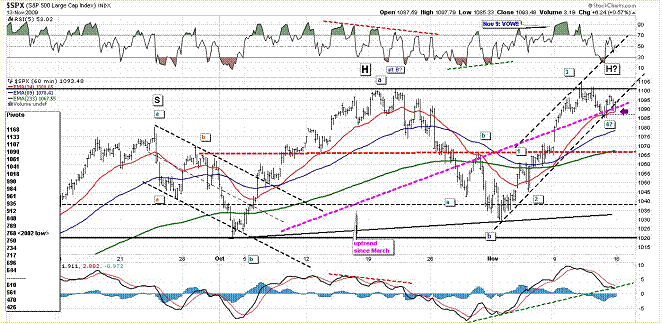
If the count on the above chart is correct, at least one more wave up is needed to complete a wave set from the low earlier this month. Notice how index has stopped dropping around the long term trend line since the March low and the short term trend line since the early November low. I like to remind you that it is possible for be that the above intraday count to be correct but minute (green) wave 4 not having finished yet.
As an alternate count, there also is a possibility that the index has already topped – less probable, but technically possible
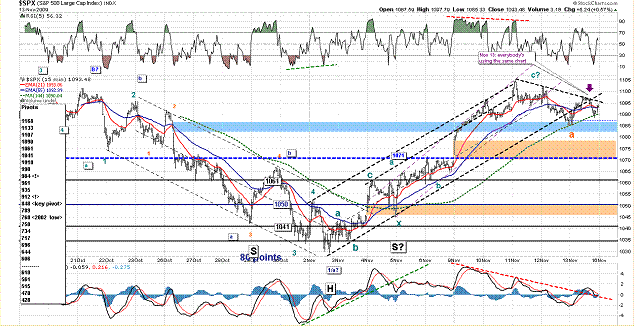
Look where the index stopped its crawl upward yesterday. Is the market being played by technicians only? – and all using the same chart? I wonder!
Below where the index closed on Friday, there are a couple of open gaps to the upside. Currently index is dilly-dallying around a filled gap that opened to the downside on October 26. Playing the index here should not be very difficult. There is a chop zone between pivot points 1061-1107 that is best avoided by the risk averse. A break above and below this zone may be played in the direction of break. But I shall not forget to decide on my exit strategy before entering a trade. A Trend may be a friend, but stops are family!
Last week, S&P looked anemic and in need of new blood (aka money). There are structural deficiencies that need repair (money) by the bulls. It is still a market of bulls by the bulls for the bulls. It is their ball to drop.
Support is at 1090, and 1061. Resistance is 1107 and 1133.
Short term trend seems to have turned up. Mid-term trend is up. Long term trend is down
Have a Nice Weekend!
By Piazzi
http://markettime.blogspot.com/
http://markettime.wordpress.com/
I am a self taught market participant with more than 12 years of managing my own money. My main approach is to study macro level conditions affecting the markets, and then use technical analysis to either find opportunities or stay out of trouble. Staying out of trouble (a.k.a Loss) is more important to me than making profits. In addition to my self studies of the markets, I have studied Objective Elliott Wave (OEW) under tutorship of Tony Caldaro.
© 2009 Copyright Piazzi - All Rights Reserved Disclaimer: The above is a matter of opinion provided for general information purposes only and is not intended as investment advice. Information and analysis above are derived from sources and utilising methods believed to be reliable, but we cannot accept responsibility for any losses you may incur as a result of this analysis. Individuals should consult with their personal financial advisors.
© 2005-2022 http://www.MarketOracle.co.uk - The Market Oracle is a FREE Daily Financial Markets Analysis & Forecasting online publication.


