Commodity Companies Index (CCI) Up 214% YTD!
Commodities / Commodities Trading Nov 12, 2009 - 01:20 AM GMTBy: Lorimer_Wilson
Up until now investors, analysts and newsletter writers have relied on the price performance of the commodities themselves (such as gold, silver, crude oil, etc.), the Reuters CRB Commodity Index or the HUI, XAU, GDM or CDNX indices to determine the health, performance and trends in commodities.
Fortunately, for all concerned, a new index has been introduced that provides a much more all-encompassing mix of companies associated with a wide variety of commodity-related products. It is called the Commodity Companies Index (CCI).
Unlike the large-cap centric HUI, XAU and GDM indices and the nano-cap centric and less commodity-oriented CDNX index, the CCI is broadly diversified across a wide range of commodities and company formats. The index consists of 35 commodity-related companies with associated warrants of at least 24 months duration that trade on the U.S. and Canadian stock exchanges.
20 of the companies in the index are either in the production, development and/or exploration of gold and silver or as royalty payment participants; 10 companies are engaged in the mining and/or development/exploration of uranium, coal, iron ore, zinc, cobalt, molybdenum, lead, copper or nickel; 3 are venture capital ‘banks’ specializing in commodity-related company financing and 2 companies are involved in oil and gas production. Talk about an all-inclusive cross-section of companies involved in the commodity business.
In addition to broad product diversification the 35 companies have a broad market capitalization spectrum with 11% being large-cap, 11% mid-cap, 11% small-cap and 66% micro/nano-cap constituents. Please refer to www.preciousmetalswarrants.com/FreeBasicDatabase.htm for a list of the actual constituent/component companies.
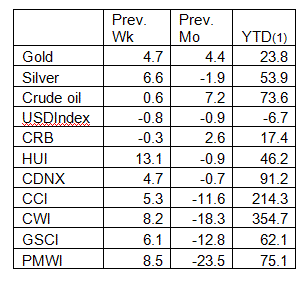
Below is a table that differentiates the performance of the major commodities and related indices which sheds considerable light on the performance of the commodity companies as a sector (i.e. the CCI) vis-à-vis the other categories:
Last Week’s % Performance

All calculations are based on U.S. dollar equivalents
(1) Week ending November 6th, 2009
Sources: preciousmetalswarrants.com (warrant and stocks-with-warrants data), oanda.com (exchange rates) and stockcharts.com (index and commodity prices).
There you have it! Finally, a better way to analyze the performance of companies involved in commodity related activities be it precious metals, base metals, oil and gas production or venture capital merchant banks. No longer need we rely on the HUI, the CDNX and the CRB for our understanding of what is happening in the commodities sector. Now we have a much broader picture.
Lorimer Wilson is Editor of www.MunKnee.com and Director of Marketing for the two sites outlined below. He can be contacted at Lorimer@preciousmetalswarrants.com
a) www.PreciousMetalsWarrants.com provides a free one-of-a-kind database (updated weekly) on all commodity-related warrants trading on exchanges in the United States and Canada. PMW also offers a modestly priced subscription service that ranks all warrants according to our proprietary leverage/time calculations at four projected stock price appreciation levels. You can also sign up for a free weekly email highlighting events in the precious metals marketplace and in the wonderful world of warrants in particular.
b) www.InsidersInsights.com, another modestly priced subscription service, alerts subscribers as to when corporate insiders of a limited number of junior mining and natural resource companies are buying and selling.
© 2009 Copyright Lorimer Wilson- All Rights Reserved
Disclaimer: The above is a matter of opinion provided for general information purposes only and is not intended as investment advice. Information and analysis above are derived from sources and utilising methods believed to be reliable, but we cannot accept responsibility for any losses you may incur as a result of this analysis. Individuals should consult with their personal financial advisors.
Lorimer Wilson Archive |
© 2005-2022 http://www.MarketOracle.co.uk - The Market Oracle is a FREE Daily Financial Markets Analysis & Forecasting online publication.


