


Stock Market Breadth Trying To Make Bullish Turn
Stock-Markets / Stock Index Trading Nov 11, 2009 - 07:36 AM GMTBy: Chris_Ciovacco

 Below we'll cover a potentially positive development in market breadth. Wednesday morning's financial headlines may help breadth continue to improve in a bullish fashion:
- Bank Of England Open To More Bond Buys (Stimulus)
- China's Industrial Production Up 16.1%
- Machine Orders In Japan Climb 10.4%
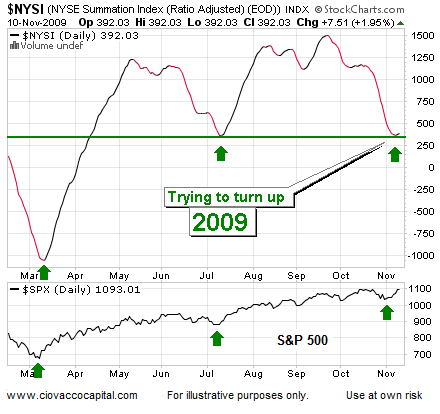
The McClellan Summation Index is a market breadth indicator that is derived from the number of advancing and declining stocks in a given market. The concept of breadth is easy to understand; healthy markets have broad participation during rallies.
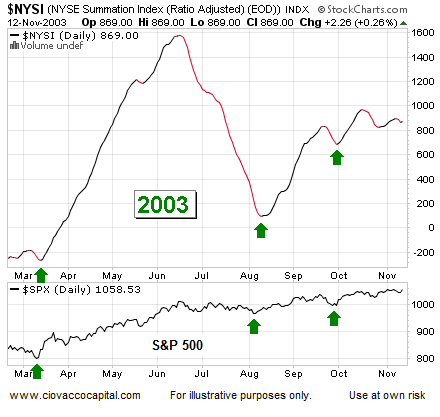
The charts below show the current Summation Index (2009) and the Summation Index from the early stages of the 2002-2007 bull market (2003). Both charts show the S&P 500 Index under the Summation Index. When the Summation Index experiences a sharp decline followed by a bottom, it can mark the end of a correction in stocks. Compare the green arrows in the Summation Index with the green arrows on the S&P 500. In 2009, the Summation Index is trying to make a turn simultaneously as stocks try to find their footing after a sharp correction. The Summation Index could break below the green line, which would possibly signal more downside for stocks. Current levels on the Summation Index are very similar to those found at the July bottom in the S&P 500. Stocks rallied off the July lows and the Summation Index continued higher helping confirm the end of the July 2009 correction.
The Summation Index should not be used in isolation. However, it can help add to the bullish or bearish weight of the evidence when using input from numerous sources and markets. It may be worth monitoring in the days ahead. The November edition of the Asset Class Outlook contains numerous charts which compare and contrast short-term and longer-term corrections within a relatively new bull market, which may be helpful given the volatility in recent weeks. The Asset Class Outlook (ACO) is available for download via this page.
Low Volume Rallies
While market breadth is possibly making a turn for the better, trading volume has been light on rallies. All things being equal, we would like to see volume pick up on rallies and volume drop on declines. Money managers are always concerned about volume (as they should be). We are concerned about low volume. However, as shown in the chart below, low volume may not be a show-stopper for relatively new bull markets.
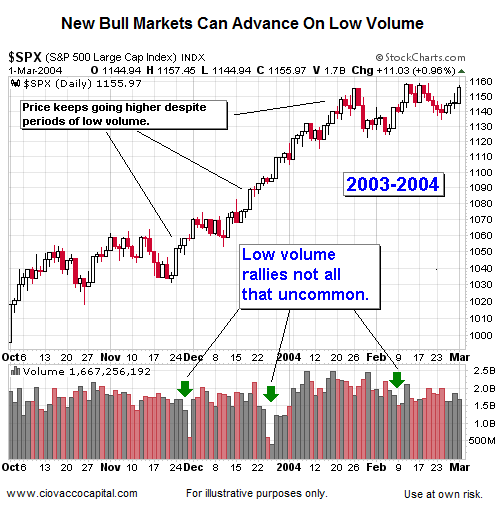
If it can exceed 1,100, the S&P 500 may face channel resistance between 1,122 and 1,150ish. Regardless of the chart above, we would love to see some strong volume on an up day for stocks. ACO also covers possible S&P 500 support and resistance after the recent bearish break of an ascending wedge.
By Chris Ciovacco
Ciovacco Capital Management
Copyright (C) 2009 Ciovacco Capital Management, LLC All Rights Reserved.
Chris Ciovacco is the Chief Investment Officer for Ciovacco Capital Management, LLC. More on the web at www.ciovaccocapital.com
Ciovacco Capital Management, LLC is an independent money management firm based in Atlanta, Georgia. As a registered investment advisor, CCM helps individual investors, large & small; achieve improved investment results via independent research and globally diversified investment portfolios. Since we are a fee-based firm, our only objective is to help you protect and grow your assets. Our long-term, theme-oriented, buy-and-hold approach allows for portfolio rebalancing from time to time to adjust to new opportunities or changing market conditions. When looking at money managers in Atlanta, take a hard look at CCM.
All material presented herein is believed to be reliable but we cannot attest to its accuracy. Investment recommendations may change and readers are urged to check with their investment counselors and tax advisors before making any investment decisions. Opinions expressed in these reports may change without prior notice. This memorandum is based on information available to the public. No representation is made that it is accurate or complete. This memorandum is not an offer to buy or sell or a solicitation of an offer to buy or sell the securities mentioned. The investments discussed or recommended in this report may be unsuitable for investors depending on their specific investment objectives and financial position. Past performance is not necessarily a guide to future performance. The price or value of the investments to which this report relates, either directly or indirectly, may fall or rise against the interest of investors. All prices and yields contained in this report are subject to change without notice. This information is based on hypothetical assumptions and is intended for illustrative purposes only. THERE ARE NO WARRANTIES, EXPRESSED OR IMPLIED, AS TO ACCURACY, COMPLETENESS, OR RESULTS OBTAINED FROM ANY INFORMATION CONTAINED IN THIS ARTICLE. PAST PERFORMANCE DOES NOT GUARANTEE FUTURE RESULTS.
Chris Ciovacco Archive |
© 2005-2022 http://www.MarketOracle.co.uk - The Market Oracle is a FREE Daily Financial Markets Analysis & Forecasting online publication.