The Case For Jobless Economic Growth
Economics / Economic Recovery Nov 10, 2009 - 06:41 PM GMTBy: Hans_Wagner
 Jobless growth, a term that makes one pause. With an economy where the consumer comprises about 70% of the Gross Domestic Product (GDP), it is hard to imagine how it can grow without more people working. Yet that is what the U.S. faces as the economy recovers from the worst recession since the 1930’s.
As of October 2009, the unemployment rate in the U.S. has risen to 10.2%, a rate not seen since 1983. Historically, unemployment has turned down three to six months after the economy begins to recover. Generally, that is true, as companies do not start to hire until they see their revenues and profits climb sufficiently to cover the added costs. This time we might not be so lucky as the number of people looking for work will outstrip the supply of jobs. High unemployment will drag on for years giving us jobless growth.
Let’s look at some facts from the Bureau of Labor Statistics (BLS) to provide a proper foundation before discussing the prospect for job growth. By the way, all the tables and charts for this article are from the Bureau of Labor Statistics Labor Force Statistics from current Population Survey for October 2009.
The Facts, Nothing but the Facts
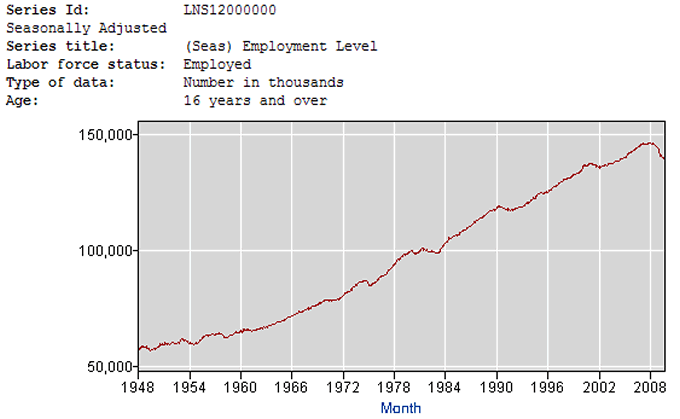
According to the BLS, there were 138.3 million jobs in October 2009 in the U.S. This number is down from a high of 146.665 million in November 2007, the beginning of the current recession. The number of jobs lost is the most ever during the last 60 years.
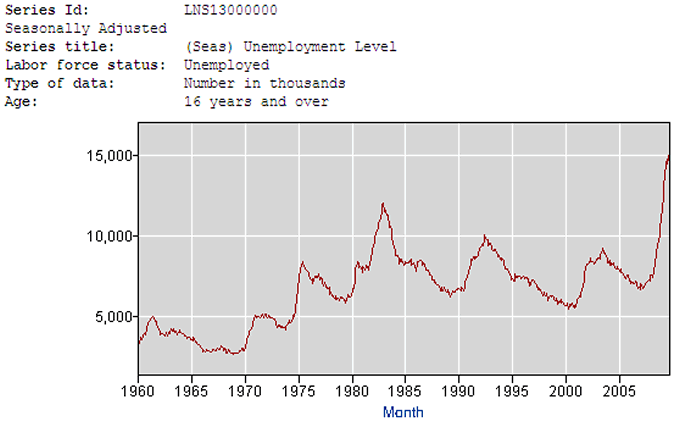
A 10.2% unemployment rate means there are 15.7 million people counted as unemployed. This number continues to climb and is up significantly from a year ago. According to the BLS “Persons are classified as unemployed if they do not have a job, have actively looked for work in the prior 4 weeks, and are currently available for work.”
Below are the chart and the table displaying the number of people classified as unemployed. The number of people unemployed is significantly higher than the level reached after the dotcom bubble burst in 2001. Many economists believe this number will peak when the unemployment rate reaches 11%, which could happen in early 2010.
In the spring of 2010, the Census Bureau will be hiring up to 3.1 million temporary workers to carry out the 2010 census. Look for a temporary drop in the number of unemployed and the unemployment rate when this happens.
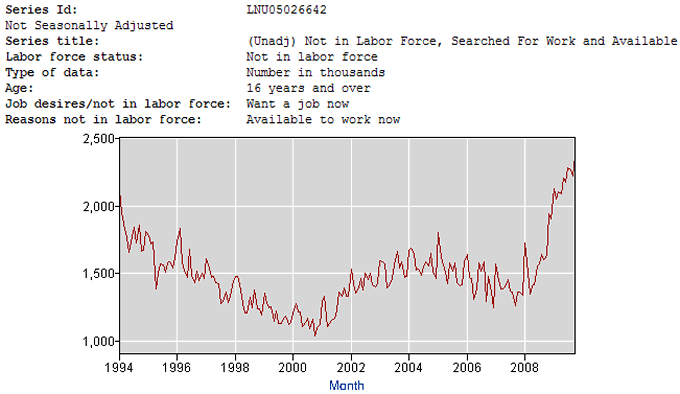
The 10.2% unemployment rate does not count the people who have not actively looked for a job in the last four weeks. In October 2009 there were 2.4 million people “marginally attached” to the labor force. The government does not count these discouraged workers as a part of the labor force even though they wanted to work or had looked for a job in the prior 12 months as they have not looked for work in the last four weeks.
Next, there are 9.3 million people working part time who want full time work. Many of these people are working in jobs well below their training and skill level. Others are working part time, as their hours have been cut back or they have been unable to find full-time work.
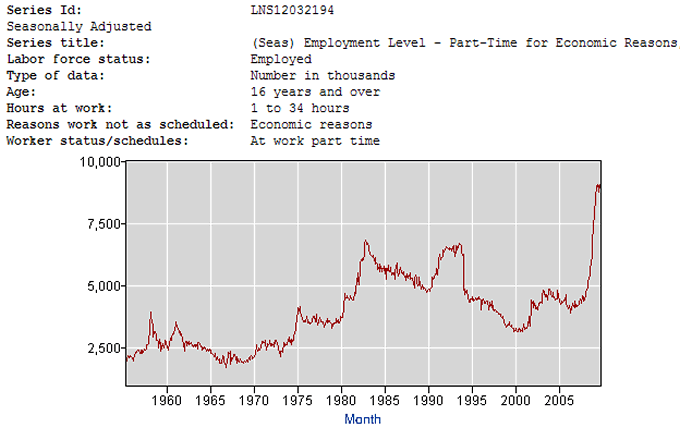
Adding all of the marginally attached workers to those counted as unemployed we reach the 17.5% of people who are out of work, have given up looking for work, or are working part time and want full time work. You might have heard about this U6 unemployment level. It is a more realistic measure of the real unemployment problem the country faces.
Job Growth Prospects
That is the bad news. What are the prospects for job growth to meet the needs of workers who are unemployed and who will be joining the work force over the next five years?
As of October 2009, the total civilian labor work force was 153.975 million. This number has been flat for more than a year as the number of discouraged workers increases. Remember discouraged workers are not counted as unemployed or part of the labor force, so they are not part of this number.
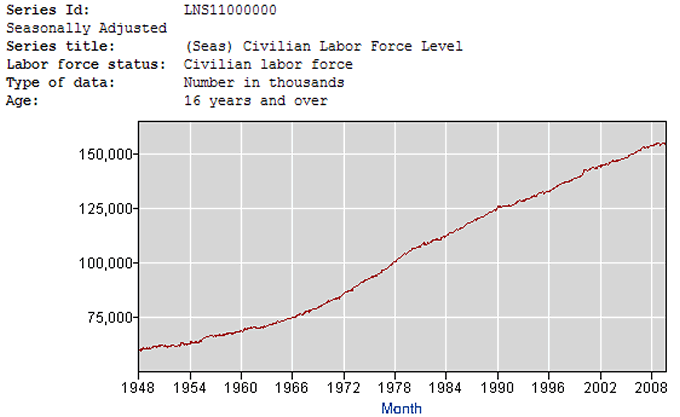
Each month 125,000 to 150,000 people join the workforce. This means the economy must produce 1.5 to 1.8 million new jobs each year to keep up with the growing work force.
For October 2009, the as reported average workweek was down to a record low of 33 hours per week, from a pre-recession level of 33.8 hours worked per week. This is another sign the demand for work is weak. If you do the math, it will take the equivalent of hiring 3 million people to get back to the pre recession level of 33.8 hours worked.
Let’s assume the economy starts to produce net new jobs by the beginning of 2010. How many jobs per month must the economy generate to bring the unemployment number down to 5% by 2014?
Starting with the 157 million in the work force as of the end of 2009, we add 1.5 million new workers or 7.5 million over the next five years, giving us 164.5 million in the labor pool.
Five percent of 164.5 million is 8.2 million unemployed at the end of 2014. This would be substantially down from the 15.7 million that were part of the 10.2% unemployed in October 2009.
To arrive at the number of jobs the economy must create, we subtract 8.2 million from 164.5 million that gives us 156.3 million jobs by the end of 2014. As mentioned above there are 139 million jobs today. This means the economy must produce 17.3 million new jobs in the next five years (156.3 million – 139 million). To arrive at 17.3 million new jobs, the economy must produce an average of 3.46 million jobs per year or 288,333 jobs per month.
For a frame of reference, let’s look at what jobs the economy produced in the last ten years to see if it is possible to generate this many jobs. The table below from the BLS shows the net change in jobs created or lost by month since 1999.
The highest twelve-month sequential rate of job creation during this period was 2.755 million jobs per year, 705,000 per year less than is needed to achieve the 5% unemployment rate. In 1999, at the height of one of the greatest periods of economic growth, 2.246 million jobs were created. Moreover, in only ten months did the number of jobs created exceeded the average number needed to reach 5% unemployment by the end of 2014.
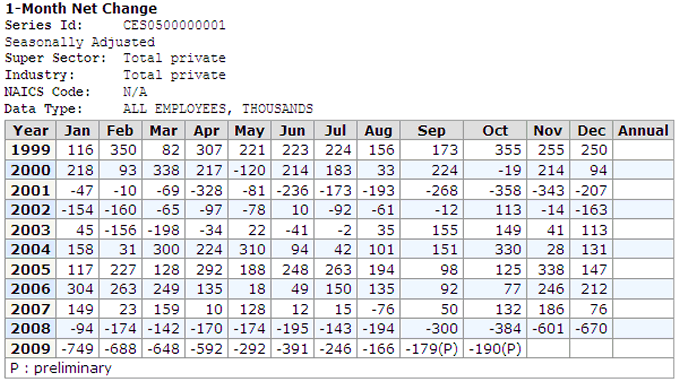
The U.S. economy is facing a huge challenge to create enough jobs to overcome the unemployment problem that currently exists. If we take the best four years since 1999, the economy generated 8.9 million jobs, slightly over half of what is needed to reach a 5% unemployment rate. If the economy achieves this level of job growth, the unemployment rate will remain over 10% in 2014. This does not count any change in the number of discouraged workers or workers working part time.
We can hope that the economy will be able to generate enough jobs to drive unemployment down to below 5% and to provide opportunities to the discouraged, marginally attached, and part-time workers. Nevertheless, we cannot count on hope. More likely, we will witness a jobless growth scenario that will leave many people unable to find meaningful work.
What This Means to Investors
As investors, we will face the prospect of high and chronic unemployment and under-employment for years to come. A jobless growth economy will limit the ability of the economy to expand. Worse, we might see solid job growth among the well-educated and total lack of job growth among those with high school or less education.
However, not all is lost. As in any economy, there will be sectors and industries that will offer better growth opportunities. We are witnessing a change in the labor force that places a premium on higher skills and education. New technologies and methods of work will be the order of the day. Global competition and trade are creating new economies that offer opportunities that did not exist before. Companies that can take advantage of these openings will offer investors significant returns. The transition to the wireless internet and the Web 2.0 will support technology companies that provide the hardware, software, and services.
Consistent high unemployment will cause the government deficit to remain high helping to devalue the U.S. dollar further. As the value of the dollar falls, it will encourage the value of commodities to rise. Higher commodity prices offer investors additional returns. A weaker dollar is a positive for exports. Any company that will benefit from a growing export sector will benefit.
As investors, we will benefit if we are careful in our selection. A jobless growth economy creates challenges as well as opportunities.
If you wish to learn more on evaluating the market cycles, I suggest you read:
Ahead of the Curve: A Commonsense Guide to Forecasting Business and Market Cycles by Joe Ellis is an excellent book on how to predict macro moves of the market.
Unexpected Returns: Understanding Secular Stock Market Cycles by Ed Easterling. One of the best, easy-to-read, study of stock market cycles of which I know.
The Disciplined Trader: Developing Winning Attitudes by Mark Douglas. Controlling ones attitudes and emotions are crucial if you are to be a successful trader.
By Hans Wagner
tradingonlinemarkets.com
My Name is Hans Wagner and as a long time investor, I was fortunate to retire at 55. I believe you can employ simple investment principles to find and evaluate companies before committing one's hard earned money. Recently, after my children and their friends graduated from college, I found my self helping them to learn about the stock market and investing in stocks. As a result I created a website that provides a growing set of information on many investing topics along with sample portfolios that consistently beat the market at http://www.tradingonlinemarkets.com/
Copyright © 2009 Hans Wagner
Hans Wagner Archive |
© 2005-2022 http://www.MarketOracle.co.uk - The Market Oracle is a FREE Daily Financial Markets Analysis & Forecasting online publication.


