Broad Stock Market Percentages Supports Bullish Outlook
Stock-Markets / Stocks Bull Market Nov 07, 2009 - 05:47 PM GMTBy: Donald_W_Dony
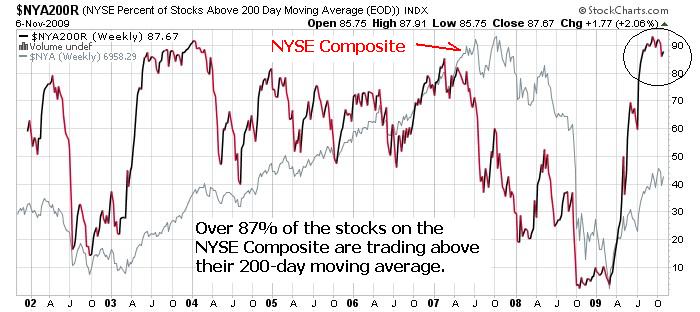
 One of the most important charts that all investors should be watching is the level of bullish participation of stocks on the NYSE Composite. This graph illustrates the number of equities that are trading above their long-term 200-day moving average on the broad-based index. Currently that level is a very bullish 87.67%. This moving average is used by numerous money managers worldwide to determine the trading direction of securities.

As many market watchers are now forecasting a retest of the March 2009 levels or lower, investors should take note that a drop of that magnitude is highly unlikely when the "Big Board" has such an impressive number of stocks trending up.
High bullish percentages typically develop in the first year of the new bull market. This is also the time when equities rise well in advance of their fundamentals. Supporting earnings to stock prices often requires another 1-2 years of economic growth to catch-up.
Deep retracements can occur when the percentage of equities above their 200-day m/a falls to 55% or below. Evidence of this action developed in 2002 and again in late 2007 to early 2009.
Bottom line: Investors should monitor the levels of bullish participation on the NYSE Composite. This can provide confirmation of the continuation of a bull market or any future weakness. High percentages (80% to 90%) indicate strong bullish activity. Levels of 55% to 80% are more sustainable for longer-term upward growth. Percentage levels of 55% or below imply downward pressure is building on the index.
Investment approach: Current data suggests the high percentage of NYSE stocks in a bull trend should persist into early 2010. Historical information indicates the percentage should then decline down to 55%-80% by mid-2010.
Your comments are always welcomed.
By Donald W. Dony, FCSI, MFTA
www.technicalspeculator.com
COPYRIGHT © 2009 Donald W. Dony
Donald W. Dony, FCSI, MFTA has been in the investment profession for over 20 years, first as a stock broker in the mid 1980's and then as the principal of D. W. Dony and Associates Inc., a financial consulting firm to present. He is the editor and publisher of the Technical Speculator, a monthly international investment newsletter, which specializes in major world equity markets, currencies, bonds and interest rates as well as the precious metals markets.
Donald is also an instructor for the Canadian Securities Institute (CSI). He is often called upon to design technical analysis training programs and to provide teaching to industry professionals on technical analysis at many of Canada's leading brokerage firms. He is a respected specialist in the area of intermarket and cycle analysis and a frequent speaker at investment conferences.
Mr. Dony is a member of the Canadian Society of Technical Analysts (CSTA) and the International Federation of Technical Analysts (IFTA).
Donald W. Dony Archive |
© 2005-2022 http://www.MarketOracle.co.uk - The Market Oracle is a FREE Daily Financial Markets Analysis & Forecasting online publication.


