The Twist on the SPY's "Squeeze"
Stock-Markets / Stock Index Trading Nov 06, 2009 - 02:11 PM GMTBy: Marty_Chenard
 Remember last week when we discussed: "The SPY squeeze"?
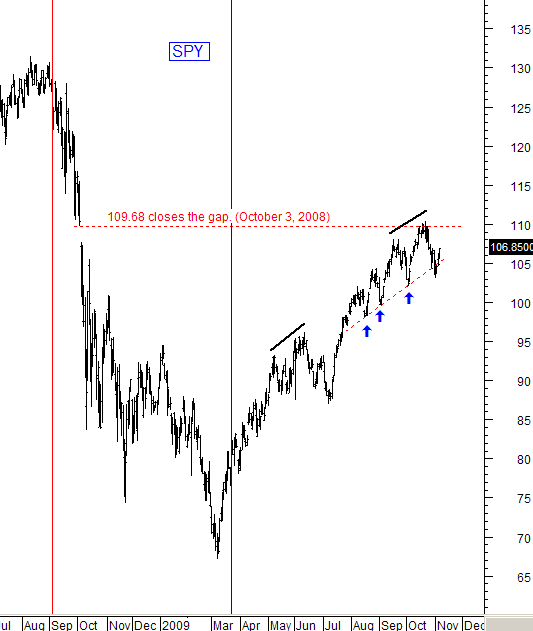
In that update, we mentioned that: "the SPY's bottom support is rising toward the gap's resistance line." We mentioned it was a "squeeze" because the distance between the resistance and support was becoming a smaller and smaller as every day went by. In other words, resistance and support are converging on each other.
Here we are a week later and that did not change as seen in the first chart. But, what is interesting is the second chart ...

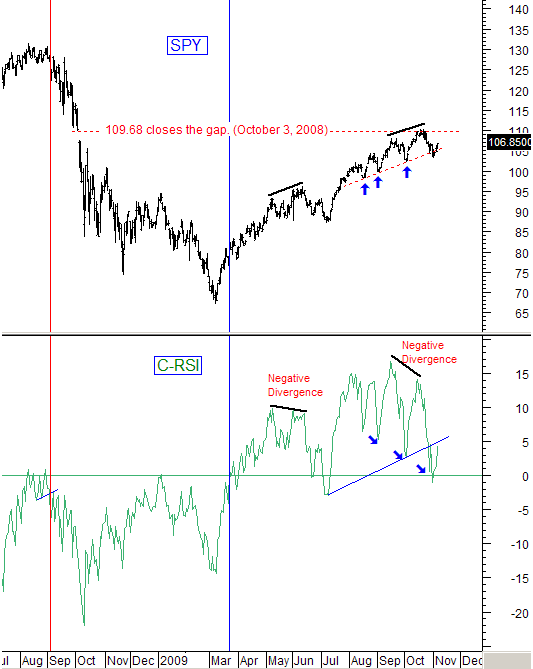
This chart shows the SPY and our C-RSI (zero based Relative Strength).
While everything appears pretty normal on the SPY's chart, it doesn't when you look at what has been happening to the SPY's Strength.
First note, that the SPY and the C-RSI has a recent "negative divergence" ... and that usually spells trouble down the road.
Now look at the blue arrows. Note that as the SPY has been moving up and making higher/lows (the definition of an up trend), the C-RSI Strength has been moving downward and making lower/lows (the definition of a down trend).
From our past postings, you know that the SPY halted its upward progress after closing its gap at 109.68. So now, the C-RSI is moving up, but has a resistance line to deal with today. If it makes it past that, then retesting the gap's resistance would be the big challenge because of the falling Strength.

** Feel free to share this page with others by using the "Send this Page to a Friend" link below.
By Marty Chenard
http://www.stocktiming.com/
Please Note: We do not issue Buy or Sell timing recommendations on these Free daily update pages . I hope you understand, that in fairness, our Buy/Sell recommendations and advanced market Models are only available to our paid subscribers on a password required basis. Membership information
Marty Chenard is the Author and Teacher of two Seminar Courses on "Advanced Technical Analysis Investing", Mr. Chenard has been investing for over 30 years. In 2001 when the NASDAQ dropped 24.5%, his personal investment performance for the year was a gain of 57.428%. He is an Advanced Stock Market Technical Analyst that has developed his own proprietary analytical tools. As a result, he was out of the market two weeks before the 1987 Crash in the most recent Bear Market he faxed his Members in March 2000 telling them all to SELL. He is an advanced technical analyst and not an investment advisor, nor a securities broker.
Marty Chenard Archive |
© 2005-2022 http://www.MarketOracle.co.uk - The Market Oracle is a FREE Daily Financial Markets Analysis & Forecasting online publication.


