U.S. Dollar Tops, while Precious Metal Stocks Bottom
Commodities / Gold & Silver Stocks Nov 06, 2009 - 02:07 PM GMT  There’s More to Seasonality Than Summer Doldrums - This has surely been an exciting week for gold and silver investors. The post-Halloween rally that I mentioned in the previous Premium Update, took metals and corresponding stocks substantially higher, and gold itself reached new highs – at least in nominal terms. The mainstream media are now reporting gold-related stories on a big scale and „gold prices“ is the second most often searched for phrase on http://finance.yahoo.com.
The contrarians among us might be concerned about this fact, as we all know what happens, when everyone gets on the same side of the boat. However, gold DID break above $1,000 recently, and also verified it, so the excitement now is quite natural. In other words – there is no divergence that would indicate that a top is in. On the other hand, I’m still receiving e-mails, in which Readers suggest that gold does not have to go up, that its too high, etc. This is encouraging, because it meanst that a certain amount of investors is still out of the market, and can get in, thus fueling further gains.
The divergence that I’m referring to would take place if we were getting close to serious resistance levels after a huge rally without any breather whatsover, and still everyone and their brother would be bullish on gold. This is what I prefer to see, as a confirmation, when timing tops. I don’t know if you recall this, but that was the case before the February 2009 top.
If you’ve been reading the news and following our essays you know that the IMF announced in September that it would sell 403 tons to finance loans to developing nations. It was a foregone conclusion that the IMF would sell the entire amount to central banks rather than flood the open market. Central banks themselves are no longer selling gold. Rather they are holding on to their gold reserves as the value of fiat currencies decline. In some cases they are increasing their holdings as countries like China, with large holdings of U.S. dollar assets, are worried about the declining value of the U.S. dollar.
Therefore, we have another signal that the fundamental situation remains favorable. Still, it is not fundamental factors that drive markets in the short- and medium-term – emotions do. This is why we need to turn to charts (courtesy of http://stockcharts.com) and their analysis for more details as to what the next several weeks and months may bring us. Let’s begin with the U.S. Dollar.

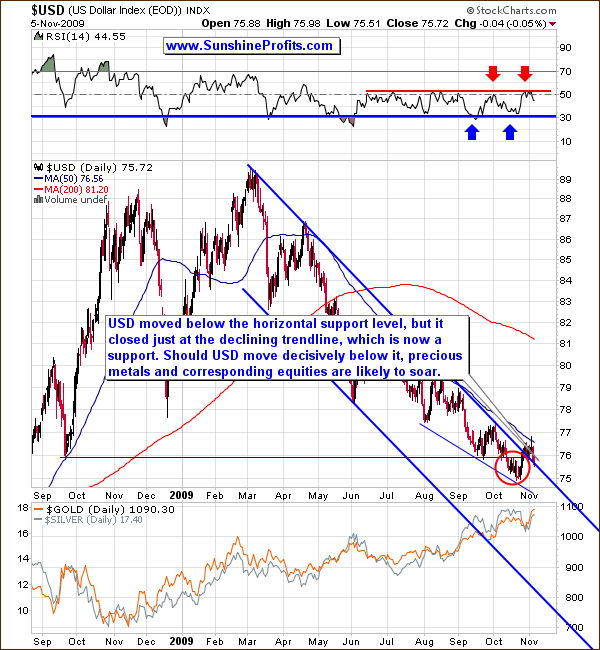
The medium-term chart confirms that the „breakout“ has been barely visible, and that it is not a significant development – at least not yet. The previous breakdown below the September 2008 low has been verified by trading for a few weeks within the red-ellipse area, after which it moved once again above this price level. Yet, this rally did not take the USD Index very far – after an intraday spike on Tuesday, dollar moved much lower. The action in the RSI indicator suggest that a local top is behind us.
If we get a move below the 75.5 level – which I consider likely – it would serve as a non-confirmaton of the breakout, and that is a very strong bearish signal. Naturally, it would be a very strong bullish signal for gold. Given the recent strength of the yellow metal it seems that even if we would see USD rally from here, the only thing it would cause gold to do is to consolidate by trading sideways for some time. Going back to the USD Index itself, please take a look at the short-term chart below.

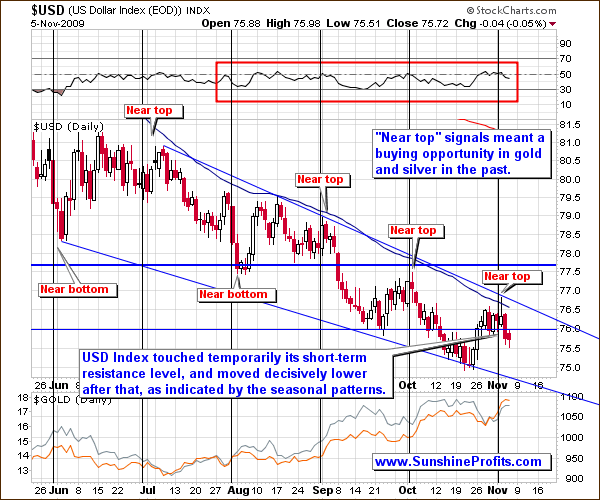
The short term chart reveals that the Tuesday top materialized almost exactly on the day that was indicated by the seasonal pattern (marked with the black vertical line) and it took place just after touching the short-term resistance level. This means that the counter-trend „rally“ phase is already behind us, and that lower prices are to be expected in the next several days (and probably also weeks).
Please note that the „near top“ vertical lines have also marked favorable buying opportunities in gold and silver. These were not necessarily the exact bottoms in the precious metals, but they were close enough for one to be glad that they purchased PMs at that time. Since it was only a few days ago, it serves us as another factor pointing to the necessity of being already in the precious metals market at least (!) with one’s long-term holdings.
However, the sitaution in the precious metals stocks is a little more complicated. Let’s turn to the chart of the GDX ETF (proxy for the sector) for details.

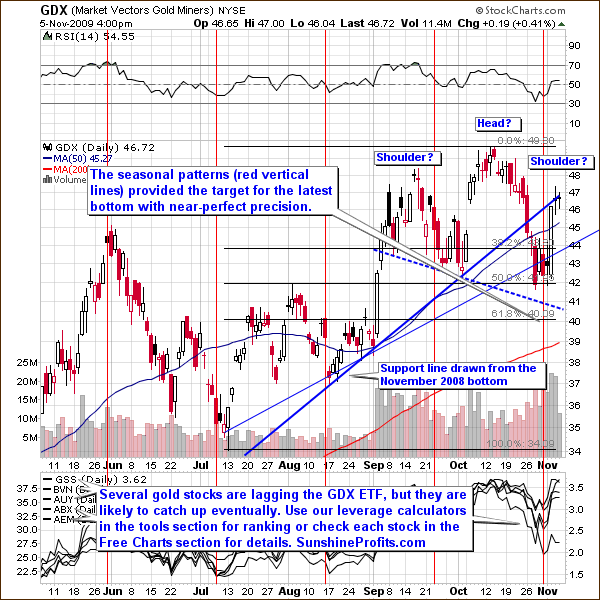
The precious metals stocks moved higher along with the rest of the precious metals market, but the shape of the rallies in the past two months may make you concerned that PM stocks are forming the head-and-shoulders top formation. I agree that the price pattern itself is visible, but I don’t thing that there is much too worry about. The head-and-shoulders pattern is formed when there is simply not enough buying power to push price to higher levels.
In the „head“ part of the pattern the price fails to go much above the previous top, and in the final, third attempt to move to new highs, it doesn’t even go above the previous (head) one. Since there is not enough buying power, the volume is lower with each upswing predecing a top (shoulder/head/shoulder). Without the confirmation in form of declining volume the whole logic behind this formation is flawed. That is precisely the case with the precious metals stocks, as this weeks rally took place on a huge volume – definitely higher than the one on which the „head“ was formed. Therefore, I don’t think that the head-and-shoulders pattern should concern you at this point.
On the other hand, the RSI is not overbought, so further gains are possible and likely. It seems that the bottom has been put exactly in tune with the seasonal tendency (red vertical lines on the chart), and higher prices are to be expected. The volume has been low yesterday, which is a natural during a small consolidation after a quick move. Several precious metals stocks have been lagging the GDX ETF lately, but I wouldn’t worry about this situation, as it is normal, especially near local bottoms.
Summing up, the popularity of gold as an investment has grown in the past several weeks, but this fact by itself is not enought to turn the long-term outlook for PMs bearish. The price of gold is moving higher and central banks begin to accumulate it instead of dumping it on the market, thus invalidating one of the key arguments against holding the yellow metal. The situation in the PM stocks is more cloudy, as this market is more likely to be influenced by a sell-off in the general stock market, but at this point the technical of the GDX ETF don’t point to lower prices in the near term.
In other news, the results of the recent survey for my Subscribers indicate that the „seasonal patterns” (used also in this week’s analysis) are very popular, and therefore I’m beginning to develop additional unique charts/tools based on them. To make sure that you are notified once the new features are implemented, and get immediate access to my free thoughts on the market, including information not available publicly, I urge you to sign up for my free e-mail list. Sign up today and you'll also get free, 7-day access to the Premium Sections on my website, including valuable tools and charts dedicated to serious PM Investors and Speculators. It's free and you may unsubscribe at any time.
Thank you for reading. Have a great and profitable week!
P. Radomski
Editor
Sunshine Profits
Interested in increasing your profits in the PM sector? Want to know which stocks to buy? Would you like to improve your risk/reward ratio?
Sunshine Profits provides professional support for precious metals Investors and Traders.
Apart from weekly Premium Updates and quick Market Alerts, members of the Sunshine Profits’ Premium Service gain access to Charts, Tools and Key Principles sections. Click the following link to find out how many benefits this means to you. Naturally, you may browse the sample version and easily sing-up for a free trial to see if the Premium Service meets your expectations.
All essays, research and information found above represent analyses and opinions of Mr. Radomski and Sunshine Profits' associates only. As such, it may prove wrong and be a subject to change without notice. Opinions and analyses were based on data available to authors of respective essays at the time of writing. Although the information provided above is based on careful research and sources that are believed to be accurate, Mr. Radomski and his associates do not guarantee the accuracy or thoroughness of the data or information reported. The opinions published above belong to Mr. Radomski or respective associates and are neither an offer nor a recommendation to purchase or sell securities. Mr. Radomski is not a Registered Securities Advisor. Mr. Radomski does not recommend services, products, business or investment in any company mentioned in any of his essays or reports. Materials published above have been prepared for your private use and their sole purpose is to educate readers about various investments.
By reading Mr. Radomski's essays or reports you fully agree that he will not be held responsible or liable for any decisions you make regarding any information provided in these essays or reports. Investing, trading and speculation in any financial markets may involve high risk of loss. We strongly advise that you consult a certified investment advisor and we encourage you to do your own research before making any investment decision. Mr. Radomski, Sunshine Profits' employees and affiliates as well as members of their families may have a short or long position in any securities, including those mentioned in any of the reports or essays, and may make additional purchases and/or sales of those securities without notice.
Przemyslaw RadomskiArchive |
© 2005-2022 http://www.MarketOracle.co.uk - The Market Oracle is a FREE Daily Financial Markets Analysis & Forecasting online publication.


