Research In Motion (RIMM) Stock Buyback Chart Analysis
Companies / Company Chart Analysis Nov 06, 2009 - 08:30 AM GMTBy: INO
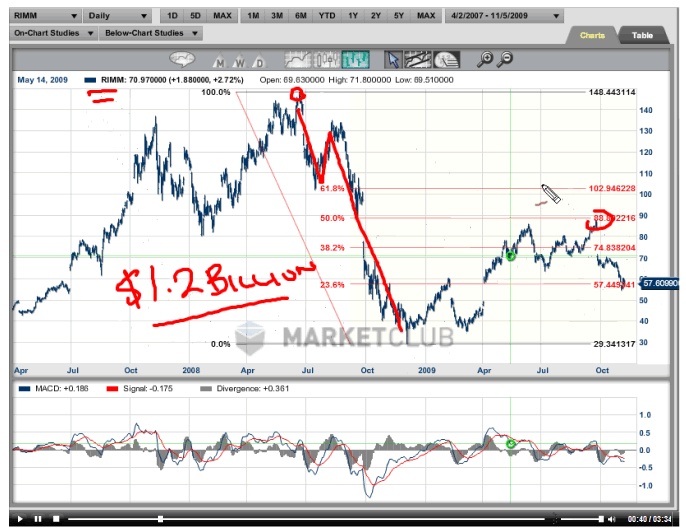
 "Research In Motion Ltd. (RIMM) will spend up to $1.2 billion to buy back about 21 million of its shares, or 3.6% of its total shares outstanding. The buyback will start Nov. 9 and last for up to one year."
That was the headline news today on Research in Motion symbol RIMM so I decided to look at the chart to see what was going on in the "real world". When I got to the chart, one thing immediately jumped out at me and that was the negative action that this market has shown in the past several weeks. Looking at this market a little closer I was able to see that our "Trade Triangle" technology was 100% negative and that our monthly "Trade Triangle" indicator had turned negative on October 28th at $63.38. This is a major negative in my mind for this market.
In this short video I show you exactly what we expect to see for RIMM in the future. I also share with you some downside targets that we are looking at which may surprise you.
You may have watched my earlier videos on RIMM versus Apple. If you missed it, you can watch that video here.
As always our videos are free to watch and there is no need to register. I hope you enjoy the video and comment about it on our blog.
All the best,
Adam Hewison
President, INO.com
Co-creator, MarketClub
By INO.com
INO and Quote Providers furnish quotes and market analysis without responsibility for accuracy and is accepted by the site visitor on the condition that transmission or omissions shall not be made the basis for any claim, demand or cause for action. The information and data was obtained from sources believed to be reliable, but we do not guarantee its accuracy. Neither the information, nor any opinion expressed, constitutes a solicitation of the purchase or sale of any futures or options..
INO Archive |
© 2005-2022 http://www.MarketOracle.co.uk - The Market Oracle is a FREE Daily Financial Markets Analysis & Forecasting online publication.


