


Any Way You Slice It, We’re at a Stock Market Top
Stock-Markets / Stock Index Trading Nov 05, 2009 - 09:28 AM GMTBy: Graham_Summers

 As you’re no doubt well aware, the US stock markets have been on an absolute tear since March 2009. Indeed, October stands as the first month stocks closed at a loss this year, which means the market had seven straight winning months in a row. This HAS to be some kind of record.
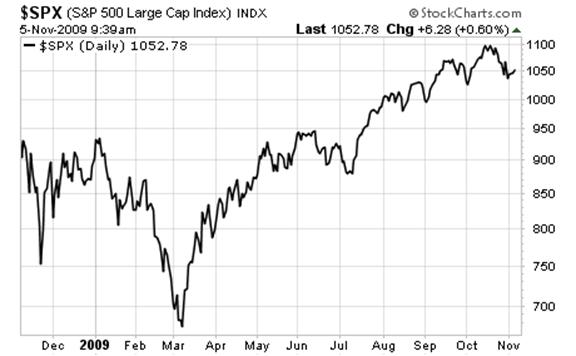
The mainstream media, looking at the above chart (and the Fed’s proclamation that the recession is over) believe we have entered a new bull market. I will admit, at first glance the market DOES look as though it’s managed to beat every significant down turn and explode higher.
The only problem is that the above chart is priced in US Dollars: a currency that has lost 15% of its value this year. Remember, investing is all about relative value: assets do NOT rise in value in a universal sense. Instead they rise relative to other assets.
Here’s a chart of the S&P 500 priced in euros:
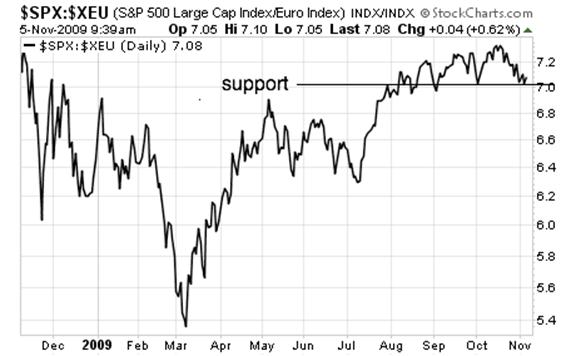
As you see, US stocks, when priced in euros, have largely been trading sideways for the last three months. I should also note that they had a significant down-turn from May-July (a period that doesn’t look NEARLY as negative when the S&P 500 is priced in US Dollars).
However, the most critical element of the above chart is the fact that the market (priced in euros) is bumping up against MAJOR support. As you can see, the market has bounced at this level no less than three times before. The bounces from this level have gotten larger, but stocks have never managed to avoid returning to this line. IF STOCKS BREAK BELOW THIS LEVEL, this forecasts a significant collapse (the gap down goes to 6.3, a full 10% lower than today’s levels).
Ok, that’s the case for the market priced in euros… but what about Japanese yen?
Practically the EXACT same chart:
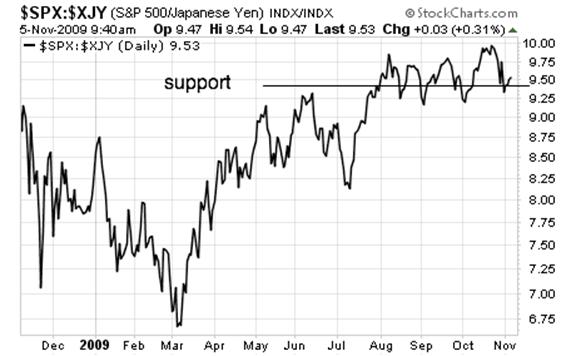
Again we see the market (priced in yen) trading sideways since August and testing a line of major support. And again, if this line is broken, there is a MAJOR gap down.
How about the market priced in Swiss francs?
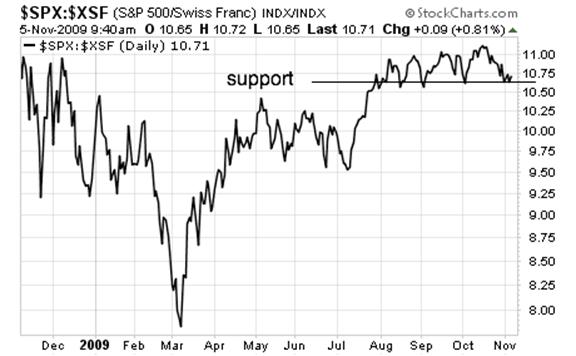
Almost identical: a sideways trading range since August, multiple tests of major support, and massive potential gap down.
All of the above tell us several things:
- ALL of the gains the S&P 500 has shown since August are mainly the result of the US Dollar losing value
- The US markets, when priced in almost every major world currency, have been trading sideways for three months now
- Priced in other currencies, the US markets are showing serious signs of a potential break-down coming (there are major gaps down in every chart)
These charts are flashing VERY serious warning signs that the US market has put in a major top. Far more importantly, there is the potential for a VERY serious collapse in US stocks. And it’s showing up in virtually EVERY currency.
I’ve stated repeatedly that I believe stocks will have another Crash this year. Looking at the above charts this could be coming sooner rather than later. When you price it in US dollars, the S&P 500 looks like it’s rising. But in any other currency, US stocks have gone NOWHERE for three months now.
Folks, the market rally since August hasn’t actually made any of us richer… it’s simply that our currency has gotten WEAKER. Either the Dollar strengthens from here (which would kick US stocks off a cliff since most of their gains are a result of the Dollar losing value) OR it rolls over, tests new lows, and US stocks (priced in Dollars) explode higher.
Neither of these situations is positive. If the Dollar rallies stocks could collapse which would decimate retirement accounts. And if the Dollar rolls over and stocks explode higher, we’re all poorer for it too (stocks will not have hit new highs based in other currencies).
Now is the time for extreme caution especially for those of you in the US. Either way you slice it, a major top has likely formed in US stocks. And either way you slice it, a LOT of people are going to lose a LOT of money in the near-future.
Don’t be one of them. I’m already preparing investors for what’s to come with a FREE Special Report detailing THREE investments that should explode when stocks start finally collapse. While most investors are complacently drifting towards the next Crisis like lambs to the slaughter, my readers are already getting ready with my Financial Crisis “Round Two” Survival Kit.
The investments detailed within this report will not only protect your portfolio from the coming carnage, they’ll also show you enormous profits: they returned 12%, 42%, and 153% last time stocks collapsed.
Swing by www.gainspainscapital.com/roundtwo.html to pick up a FREE copy today!
Good Investing!
Graham Summers
Graham Summers: Graham is Senior Market Strategist at OmniSans Research. He is co-editor of Gain, Pains, and Capital, OmniSans Research’s FREE daily e-letter covering the equity, commodity, currency, and real estate markets.
Graham also writes Private Wealth Advisory, a monthly investment advisory focusing on the most lucrative investment opportunities the financial markets have to offer. Graham understands the big picture from both a macro-economic and capital in/outflow perspective. He translates his understanding into finding trends and undervalued investment opportunities months before the markets catch on: the Private Wealth Advisory portfolio has outperformed the S&P 500 three of the last five years, including a 7% return in 2008 vs. a 37% loss for the S&P 500.
Previously, Graham worked as a Senior Financial Analyst covering global markets for several investment firms in the Mid-Atlantic region. He’s lived and performed research in Europe, Asia, the Middle East, and the United States.
© 2009 Copyright Graham Summers - All Rights Reserved
Disclaimer: The above is a matter of opinion provided for general information purposes only and is not intended as investment advice. Information and analysis above are derived from sources and utilising methods believed to be reliable, but we cannot accept responsibility for any losses you may incur as a result of this analysis. Individuals should consult with their personal financial advisors.
Graham Summers Archive |
© 2005-2022 http://www.MarketOracle.co.uk - The Market Oracle is a FREE Daily Financial Markets Analysis & Forecasting online publication.