


S&P 500 Stock Market Trends Analysis for November 2009
Stock-Markets / Stock Index Trading Nov 04, 2009 - 06:36 PM GMTBy: Hans_Wagner

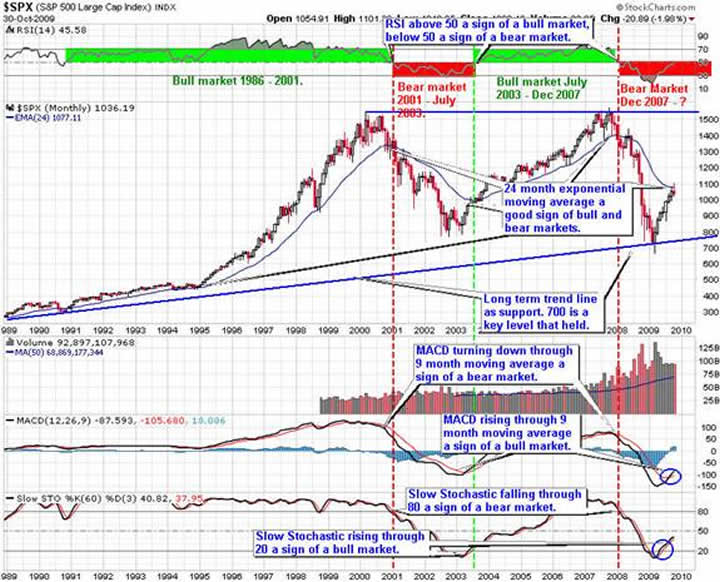
 Starting with the indexes gives an overall perspective to the markets. This is monthly chart for the S&P 500 showing 20 years of performance. Since this index is the one used by professional traders, it is important to understand how it is performing. This chart is also excellent for defining the longer-term trends for the market.
The bull market of the last five years broke down when the S&P 500 turned down through the 24-month exponential moving average. The bear market began when the index fell through the 24-month exponential moving average. Also, the RSI tested the 50 level, another important indicator of bear markets (if the RSI remains below 50 then we are in a bear market) and turned back down. The MACD crossing down through the 9-month moving average is another sign of the transition from bull market to bear market. Finally, the Slow Stochastic fell through 80 as another sign of the beginning of the bear market.
The rally that began in early March ended in October. A pull back here would be normal. The MACD turned up through the 9-month moving average indicating an end to the bear market. The Slow Stochastic rose above 20, another sign of a transition from a bear to a bull market.
Looking at the chart, we are getting close to the end of the bear market. The Slow Stochastic and the MACD have signaled an end to the bear market. The 24-month Exponential Moving Average and the RSI remain as bear market hurdles.
While history may not repeat itself, notice that in the bear market of 2001 - 2003, there was a bear market rally during April and May 2002 that reversed itself. It was another year before the bear market was over. If the market turns down from here, the indicators remain correct.
For now, I intend to invest as though we are in a more normal market that will see rallies and then pullbacks. The rally of the last eight months came as a rebound from an oversold condition as investors feared the worse. Going forward, we will experience market rallies and pull backs as the economy struggles to expand.
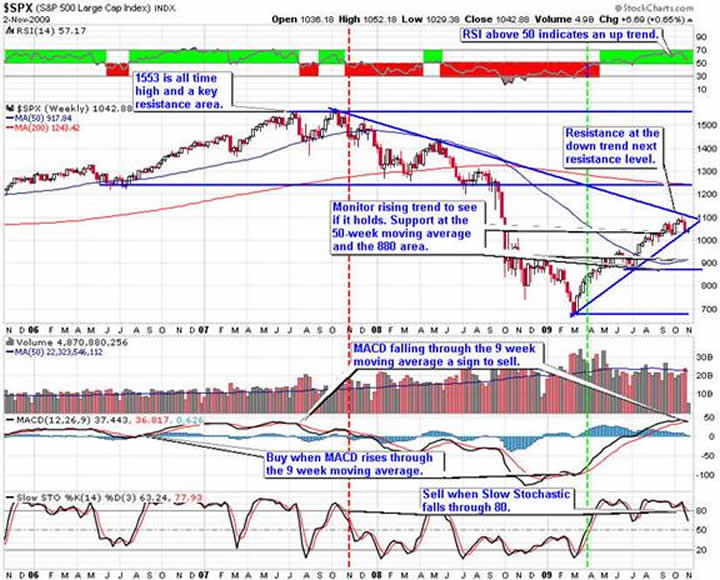
The four-year weekly S&P 500 trend chart shows that the market is at an important transition point. Resistance is just above in the form of the bear market down trend. The rising trend that has been support since the rally started in March is being tested. Failure of this support level would be a sign the eight-month rally is over and a new trend is beginning. If this support level fails, the 50-week moving average and the 880 level will offer support.
RSI is above 50, a sign of an up trend. The MACD continues to rise, though it is reaching a high point where it will eventually turn down, giving a sell signal. The Slow Stochastic fell through 80 giving a sell sign.
The weekly chart pattern indicates the S&P 500 could be ending its eighth month rally. If it does, we could be entering a period where the market moves in a horizontal channel with 1,100 as the high and 880 as the low. If this turns out to be true, it will place a premium on picking the right sectors and stocks.
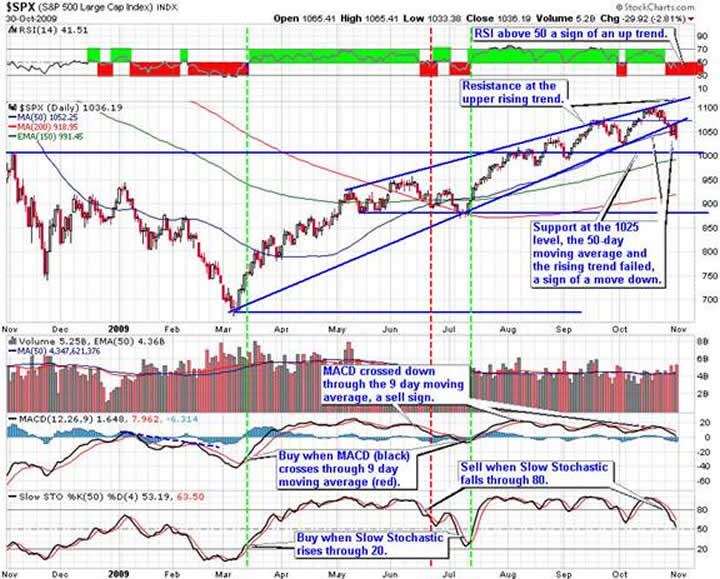
The daily S&P 500 shows the formation of a small rising wedge, a bearish formation. As expected the S&P 500 fell through the pattern, a sign of a further move down. The 50-day moving average is also failing as support. On the daily chart, there is support at the 1,000 area and the 880 level.
RSI is below 50 indicating a downtrend. The MACD turned down at the 9-day moving average, a sell sign. The Slow Stochastic turned down through 80, giving a sell sign.
The daily chart of the S&P 500 is telling us the rally has ended and it is prudent to add down side protection to your portfolio and/or sell long positions. We are likely entering a period of consolidation with the market trending in a range with multi-week rallies followed by multi-week pullbacks.
This will cause us to change our strategy going forward. Selecting the right sectors and stock picking will become more important to your success. Look to buy on dips in the market to important support levels. Then add down side protection at interim high points using trailing stops and protective put options to help improve the overall return. Covered calls options will also work well when the market is not rising as rapidly as the last six months.
Given this analysis of the S&P 500 trend line charts, it is important to have your portfolio positioned for a market that is more likely to trend in a range with more cyclical rallies and pullbacks.
The charts of the S&P 500 trend lines provide a good way for investors to align their portfolios with the overall market trends. Picking the right sectors and stocks will become even more important. Look to buy on dips in the price of the S&P 500 trend charts on the next pull back. Be sure to use proper capital management techniques including trailing stops, protective put, covered call options and position sizing. When the pull back ends, look to add to long positions with stocks and ETFs from the sectors that are likely to outperform the overall market. Keep in mind, Warren Buffett's first rule of investing is to not lose money. Be patient waiting for good entry points.
By Hans Wagner
tradingonlinemarkets.com
My Name is Hans Wagner and as a long time investor, I was fortunate to retire at 55. I believe you can employ simple investment principles to find and evaluate companies before committing one's hard earned money. Recently, after my children and their friends graduated from college, I found my self helping them to learn about the stock market and investing in stocks. As a result I created a website that provides a growing set of information on many investing topics along with sample portfolios that consistently beat the market at http://www.tradingonlinemarkets.com/
Copyright © 2009 Hans Wagner
Hans Wagner Archive |
© 2005-2022 http://www.MarketOracle.co.uk - The Market Oracle is a FREE Daily Financial Markets Analysis & Forecasting online publication.