China Up / U.S. Down Investment Risk Theme Checkup
Stock-Markets / Investing 2009 Nov 04, 2009 - 05:30 PM GMTBy: Richard_Shaw
 One big investment risk is subscribing to a popular mantra with your life’s savings, without continuously checking the data — the facts — to make sure the mantra continues to make sense.
The “China up” and “U.S. down” theme is a major current mantra. There are plenty of very bright, well informed, high profile people espousing the virtues of investing in China — people such as Marc Faber, Jim Rogers, Mohamed El-Erian, George Soros and many others.
For example, this past week Soros said that China will be the greatest winner from the global financial crisis, with the U.S. losing the most
We think that he and they are probably right, but we also think its a good idea to put data together side-by-side from time-to-time to see how the theme is holding up. Are the current fundamentals supporting the theme? Is the valuation reasonable? Is the price action in accord with the theme?
While such checking can seem unnecessary at a time like this, it is a good discipline to check facts periodically, even when it seems obvious that checking is not needed. Checking, double checking and re-validating is a good risk management discipline.
If you are on board the China theme and you are fully comfortable with that, there’s no need to read further. If you are a China skeptic or a China enthusiast who’d like to check out the facts once again, read on.
Macro-Economic View:
Here is some data, which we believe does support the current China versus U.S. theme (proxies FXI for China, and IVV or SPY for the U.S.).
First from 2008, these data are found in the CIA Factbook:
click images to enlarge
2008 US and China Economic Statistics and World Rank
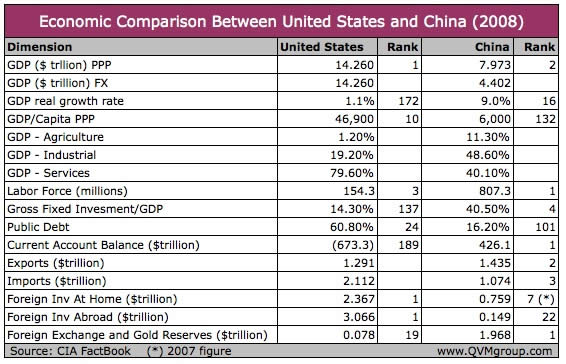
This shows the U.S. on top in size, ranked weak in terms of debt load, growth, asset re-investment, trade balance and reserve capacity to make public investments (such as major infrastructure similar to the U.S. interstate system in the 1950’s). It shows China as large and nearing the top in size, ranked strong in terms of debt load, growth, asset re-investment, trade balance and reserve capacity to make public investments.
For 2009, we have a narrower data window for China. While it reveals some important negatives lingering from the 2008 credit crisis, it is in much better shape than similar data for the U.S.
Current China Economic Statistics

Not shown in the tables is the increase in total employed people in China over the past nine months, versus the decrease in total employed people in the U.S. — an important fundamental directional indicator.
The U.S. has 6.2 million fewer employed year-over-year as of September, while China reports a year-to-date increase of 7.6 million jobs.
They have twice the employment base, making their increase only half as good as the U.S. decrease is bad, but the key is that they are growing and the U.S. is shrinking.
Current U.S. Economic Statistics
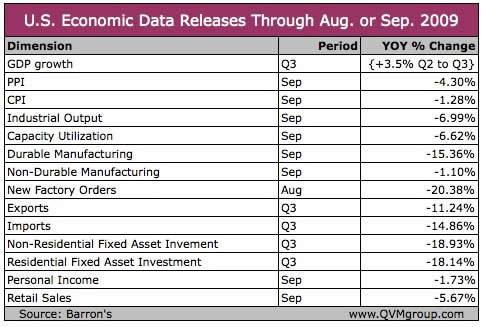
The U.S. is in a broad based negative change status — better than before, but not doing as well as China.
Valuation and Tabular Performance:
We think a trailing 20+ P/E is too high for the U.S. That is a level more appropriate for good times. These are no longer apocalyptic times, but they are definitely not good times.
Barton Biggs would certainly disagree with us on valuation. In the October 17 issue of Newsweek in “Why the Bears Are On the Way Out” he said in closing,
What could the pessimists be missing today? First and foremost, they are betting against America, the greatest entrepreneurial engine ever created. … emerging economies may well be the new dynamo of growth. They now account for 35 percent of world GDP and are growing two to three times faster than the developed world. S&P 500 companies now collect almost 50 percent of their revenues from overseas, and almost half of that portion comes from these fast-growing developing countries. Another factor could be that stocks currently despite the rally are still deeply undervalued. The rule of thumb is that stocks should sell at a price/earnings ratio equal to 20 less the inflation rate. Assume S&P 500 operating earnings are $70 to $75 next year and inflation is 1 percent, you get a theoretical price far higher than the current level of 1060. If inflation rises in the future, price/earnings ratios will fall but profits will be higher.
With Bigg’s formula, the S&P should be priced at about 1400 to 1500 instead of its current level between 1000 and 1100. No thanks, we wouldn’t touch an S&P 500 index fund for anything like 1400 to 1500 right now.
We point out that in 2005 (a time of market optimism) when the trailing operating earnings were in the $70 to $75 range, the S&P was only in the 1200 to 1250 range.
Inflation was 3% that year. The Bigg’s formula would generate: P/E = 20-3 = 17. That multiple times $70 to $75 yields a valuation of 1190 to 1275. His formula is right on target, BUT expectations are big part of valuation and his formula doesn’t include the overall stability level and trajectory we have today.
We think at least a 10% haircut for the precarious situation and long period projected for full recovery would suggest a value more like 1075 to (where we have just been) to 1150 as a top number (a possible approximate 10% rise from here) until facts on the ground and expectations improve.
Yeah, sure, cash is earning next to nothing, but earning nothing in the short-term is better than paying too much and risking too much.
Both FXI and IVV (or SPY) are similarly close to their 52-week highs and somewhat similarly close to their bull cycle highs. However, since China took a larger spill in the crisis, it has experienced a greater increase to get into the position it now finds itself relative to its highs.
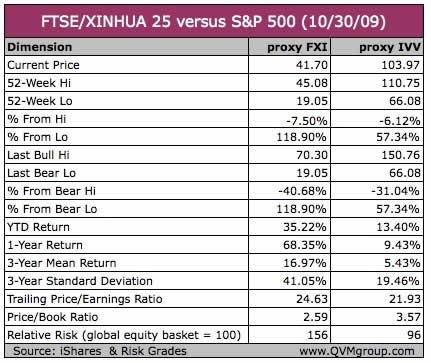
The 3-year volatility of the S&P 500 is nearly four times the 3-year mean return, but the volatility for the FTSE/Xinhua 25 (generally the largest China stocks) is only about 2.5 times the 3-year mean return.
The trailing P/E for the large China stocks is approximately 10% higher than the trailing P/E for the large U.S. stocks, but the GDP growth and other growth measures for China are a multiple of the U.S. growth measures.
That said, the ride on China stocks is very bumpy with potentially gut wrenching dives. The 3-year standard deviation is a whopping 41% and the shorter term volatility risk according to Risk Grades is about 60% higher than for the S&P 500. However, with good stop loss use, an investor can benefit by the upward volatility while limiting the downward movement exposure.
Price Behavior:
Barton Biggs makes a great point about the S&P 500 being global in nature and also about the difference between a country and the companies domiciled in it. There are great companies in many countries and lousy companies in every country; and giant global companies are not limited by the growth of their domicile.
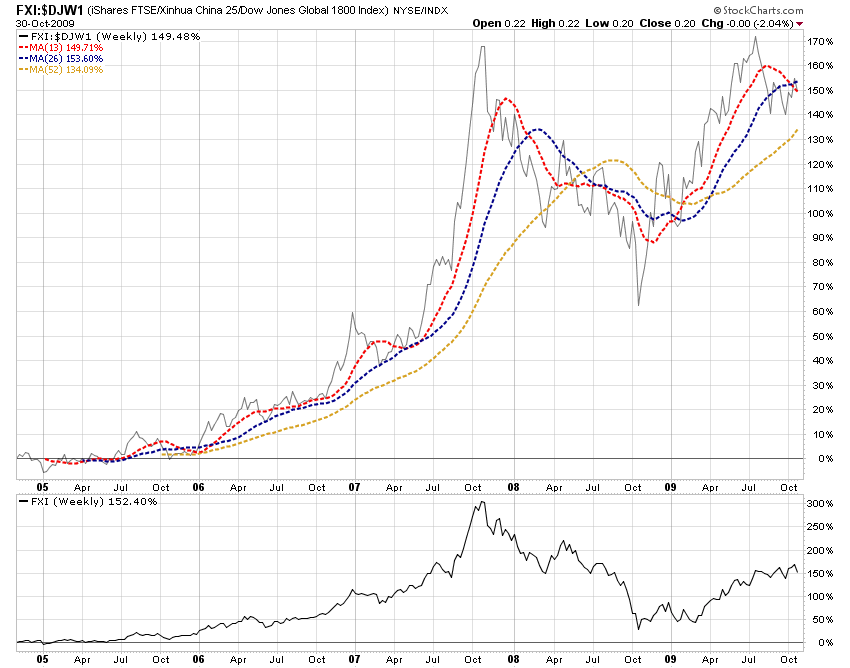
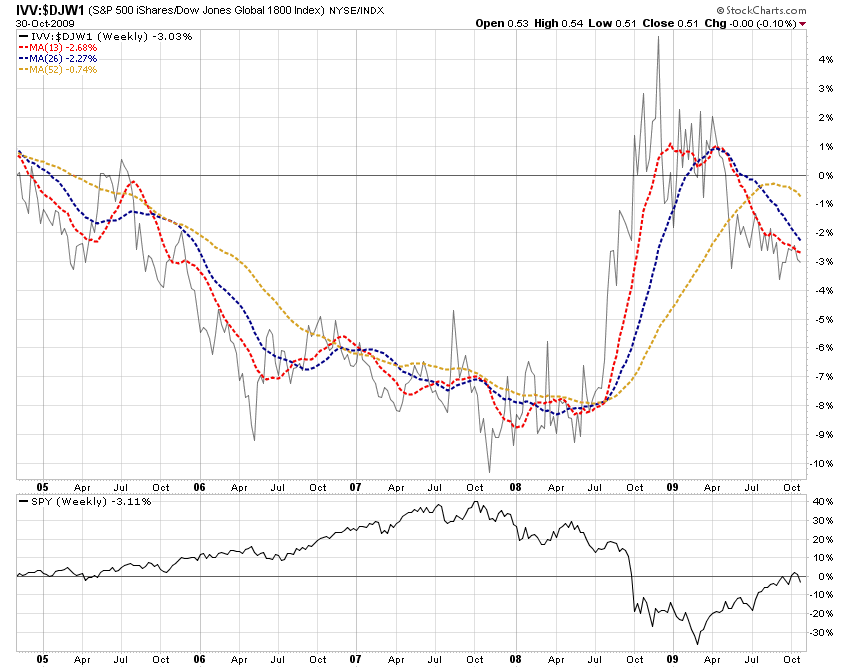
That said, the price performance of the S&P 500 versus China indexes, still favors China. The next two charts plot the FXI price performance divided by the FTSE/Total World stock index (proxy VT) and the IVV price performance divided by VT over the past 5 years. China is the hands down winner.
FXI/VT Weekly Over 5-Years
IVV/VT Weekly Over 5-Years
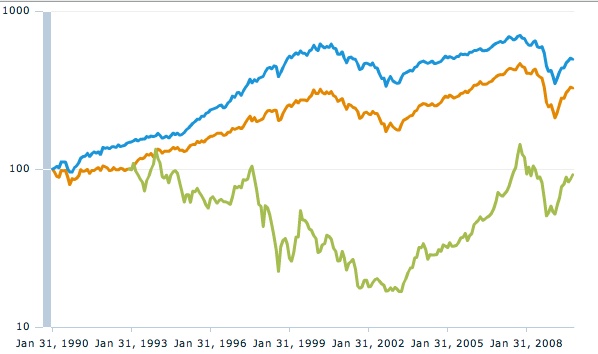
The funds we are illustrating don’t have long histories, so let’s look at some MSCI indexes for the World, China and the U.S. over 20, 10, and 5 years.
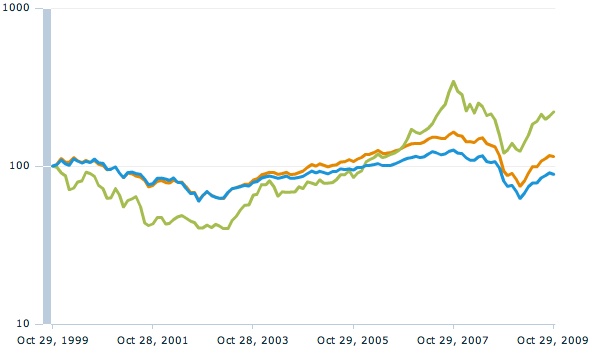
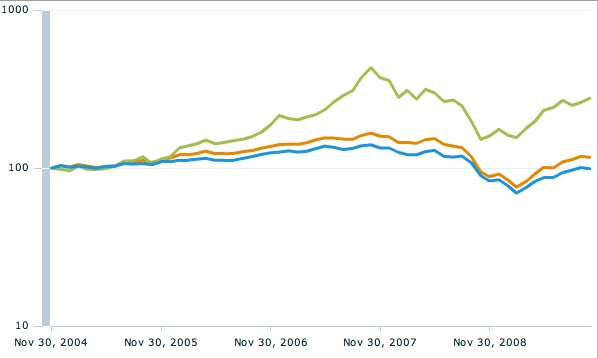
These charts are done in semi-log scale to more effectively show percentage changes over the long periods. Arithmetic scale is OK for shorter periods, but when prices change radically or if one security changes much more radically than the other, semi-log scale is better.
Over 20 years, the U.S. stock market beat the pants off of the China stock market. However, a lot has changed in both the US and China over 20 years. The U.S. has expanded its debt, hollowed out it manufacturing capacity, and put itself in a vulnerable energy resources and manufactured goods import position. China has strengthened its finances and massively built-out its manufacturing capacity and export distribution.
MSCI All Countries World, China and U.S. 20 Years
Over 10 years, the change in relative strengths becomes apparent in the price performance charts.
MSCI All Countries World, China and U.S. 10 Years
Over 5 years, China has been the clearly superior performer.
MSCI All Countries World, China and U.S. 5 Years
A Current Technical Point:
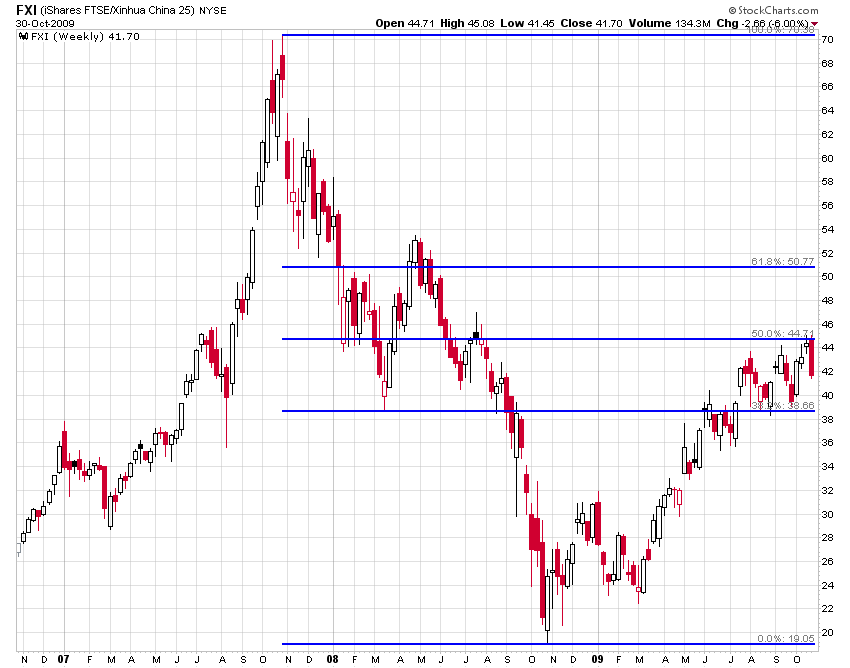
Both the S&P 500 and the FTSE/Xinhua 25 have found the 50% retracement level from the 2009 low to the 2007 highs to be resistance.
As theory goes, that is an important recovery test level. To be a long lasting and continuing bull, many would say a security must pierce its approximate 62% retracement level.
FSTE/Xinhua 25 (FXI)
S&P 500 (IVV)
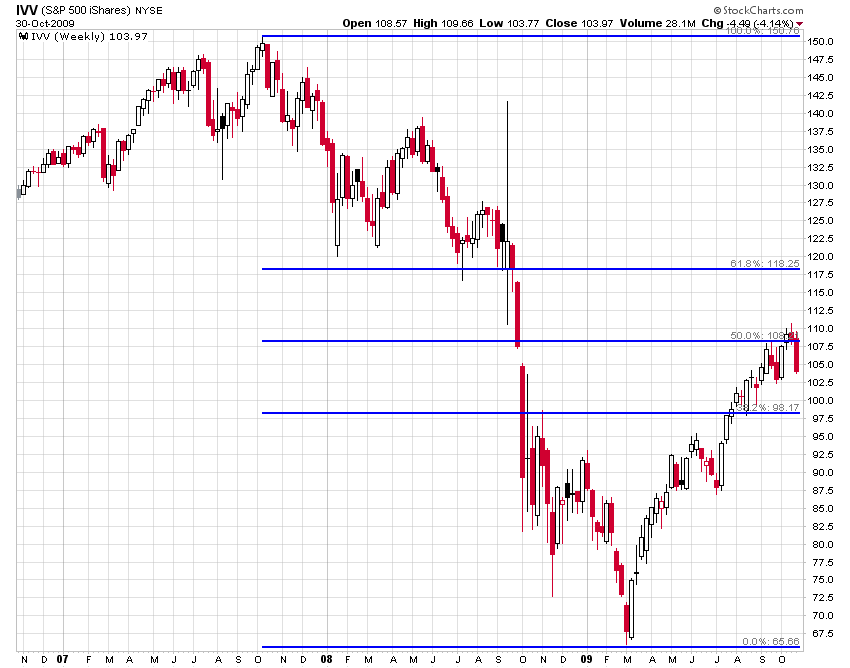
FXI looks like it has good potential for support at the 38% retracement level. While the 38% level may provide some support for the IVV or SPY, other chart information suggests support may lie below that at the June/July level or possibly even a lower high experienced at year-end 2008.
China and the U.S. Are the Epicenter of the World Economy:
The U.S. and China are so central to the world economic dialogue that it is hard to imagine other countries decoupling their price pattern too much from the fate of these two countries.
This past week, economist Martin Feldstein said that,
“Global leaders have agreed reducing global imbalances is a priority. In practice, that means reducing the U.S. $500bn current account deficit and shrinking the $350bn surplus of China. All other current account imbalances pale by comparison“.
He goes on the say that in addition to more savings in the U.S. and more consumption in China, the Dollar must fall and the Renminbi must rise.
Both China and the U.S. face potential bank problems, although the size and immediacy of those problems in the U.S. is of greater current concern.
Both countries also have delicate timing issues to resolve when and as they remove the massive relative stimulus programs they each implemented.
China’s program resulted in huge lending programs, tax cuts, major increases in capacity development (overcapacity in some sectors), and increased industrial employment output. The U.S. program resulted in financial institution capital strengthening, tax increases, capacity bailouts, and has not resulted in an increase in overall employment and industrial production.
The uses and benefits/disadvantages of the two programs are quite different, but the risk of ill-timed or badly managed withdrawal are substantial in each case.
World Free-Float Market-Cap:
Because most of the stock in the U.S. is in the free-float, and because most of the stock in China is not in the free-float, the index weights of the two countries are far more different than the relative financial size of their markets.
The U.S. represents 44.2% of the current FTSE/Total World index, while China is but 1.3% of the index. The U.K, Japan, France, Australia, Canada, Germany and Switzerland all have higher weights in the index than China, but probably none has has many eyes, ears and calculators focused upon it as China.
Conclusion:
We think the fact checking shows the China theme to be in tact. Although we exited the equities markets entirely last Wednesday morning in our active trading accounts (not in our long-term client accounts), we do expect to be back in again sometime soon. When we go back in, China will have an allocation at a multiple of its 1.3% world index weight through a combination of its weight in the emerging markets index and through a China country fund holding.
Disclosure: We do not own any of the named securities at this time.
By Richard Shaw
http://www.qvmgroup.com
Richard Shaw leads the QVM team as President of QVM Group. Richard has extensive investment industry experience including serving on the board of directors of two large investment management companies, including Aberdeen Asset Management (listed London Stock Exchange) and as a charter investor and director of Lending Tree ( download short professional profile ). He provides portfolio design and management services to individual and corporate clients. He also edits the QVM investment blog. His writings are generally republished by SeekingAlpha and Reuters and are linked to sites such as Kiplinger and Yahoo Finance and other sites. He is a 1970 graduate of Dartmouth College.
Copyright 2006-2009 by QVM Group LLC All rights reserved.
Disclaimer: The above is a matter of opinion and is not intended as investment advice. Information and analysis above are derived from sources and utilizing methods believed reliable, but we cannot accept responsibility for any trading losses you may incur as a result of this analysis. Do your own due diligence.
Richard Shaw Archive |
© 2005-2022 http://www.MarketOracle.co.uk - The Market Oracle is a FREE Daily Financial Markets Analysis & Forecasting online publication.


