Stocks, Dollar and Gold Bull Markets Inter-market Analysis
Stock-Markets / Financial Markets 2009 Nov 02, 2009 - 01:13 AM GMTBy: Nadeem_Walayat
 This analysis seeks to update the trend prospects for all three major markets into at least the end of this year by taking into account their inter-market relationships which should resolve in a more accurate projection for each individual market.
Gold Bull Market Forecast 2009, 2010 Update
Gold has had a stellar run of late, which recently saw Gold pushing to new all time highs on a near daily basis which has galvanised wider mainstream press attention to the precious metal with many gold bugs revising targets ever higher into loftier goals such as $2000 and even $4000+. Gold is one of the most popular asset classes both sought after by readers and written about by market commentators, and one of the most emailed query as to when will I update my original gold analysis of 22nd January 2009 which concluded during mid 2009, therefore this analysis seeks to project the Gold Price trend well into 2010.
Gold Price Forecast 2009 Evaluation.
My original analysis for Gold as of 22nd January concluded with a gold price trend higher into March 2009 towards a target of $960 to be followed by a subsequent decline into mid 2009 as illustrated by the original forecast graph below.
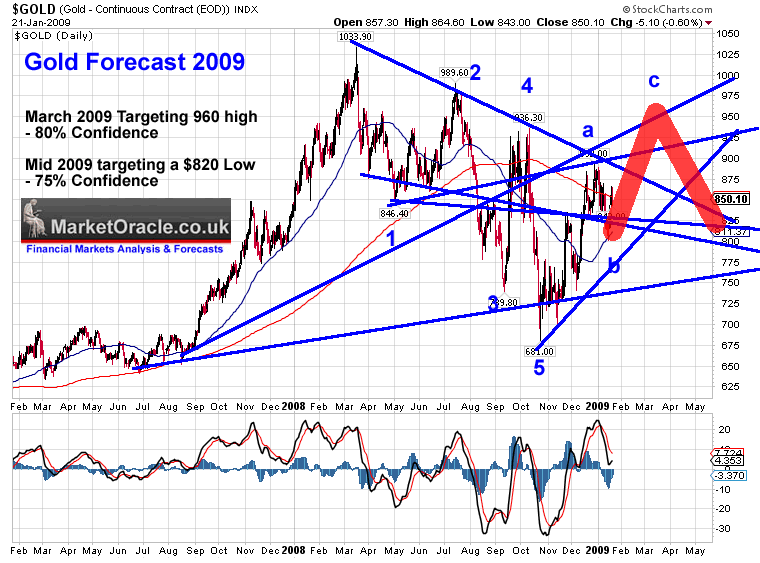
The Gold price forecast proved to be accurate in terms of the projected impulse waves. This analysis seeks to project Gold forward several months into 2010.
Fundamentals - Inflation Driving Gold?
The problem with this scenario is that the inflation of the 1980's and 1990's did NOT drive Gold higher, so clearly the mantra of Inflation driving gold higher is not correct, especially as we are presently emerged in debt deleveraging deflation, and neither does discounting future inflation expectations hold up, as the Gold bull market is now into its 10th year with a gain of 400% to date.
Gold Secular Bull Market
From 1980 to 1999 Gold fell for 20 years, eventually it would bottom and embark on a bull market, eventually, the signs for this would be not in fundamental data, but contained within the price chart as Gold breaks the pattern of corrective rallies followed by the downtrend resuming to new bear market lows. Now some 9 years later gold has corrected the preceding secular bear market by 50% in time and 100% in price. Therefore gold is not in a new bull market which has already contained many vicious bear markets within it as we witnessed last October, so just bare in mind that this is not a fresh young bull market, therefore much of the talk of waiting for public participation to join in can be discounted.
U.S. Dollar / Credit Crisis
My analysis of a positive trend for the USD clearly implies given the inter market relationship between a two for a weaker trend for Gold. However the risk is that amidst the next phase of the global financial crisis as the bankrupt banks have far from recovered, the next stage of the banking crisis accompanied by recognised inflationary panic measures of money printing which devalues all fiat currencies could give a lift to gold.
Quantitative Easing aka Money Printing Hedging
We are in a new world (for the west anyway) and that is a world of Quantitative Easing, the more the governments of the world print money and monetize debt the easier it is for governments to keep printing and monetizing ever escalating amounts of government debt to cover the government budget deficit gap. What this means is collective currency devaluation where relatively speaking there appears to be little change but in real terms the flood of money has to be seen in rising commodity prices and other scarce resources, after all the supply of resources is mostly known and the population of the world is not decreasing so the demand is known to be on an upward curve. Therefore as long as the central bankers are embarked on the experiment of quantitative easing that should give a lift to gold and other commodities as it increases inflation expectations and therefore inflation hedging using gold and more liquid commodities such as crude oil.
Gold Technical Analysis
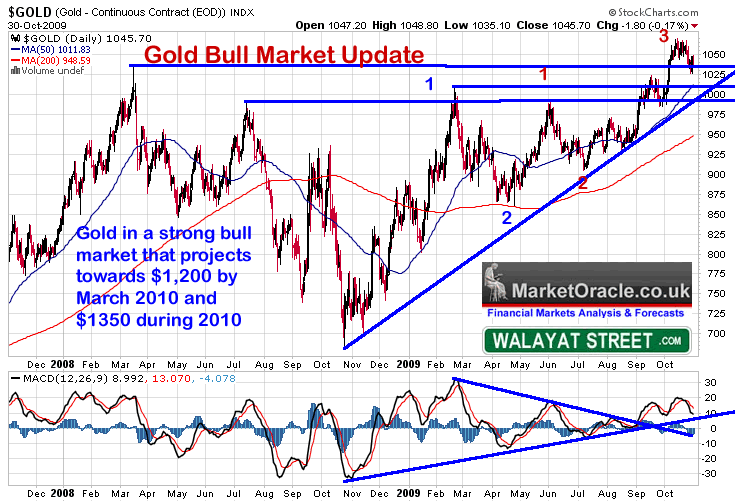
ELLIOTT WAVE THEORY - The elliott wave pattern implies we are a strong bull market that has much further to run, i.e. in Wave 4 of a larger Wave 2 advance. This also suggests that the immediate future should see further weakness in gold towards $1,000. However, this is just a correction in the trend that projects to a price of more than $1,100 by the end of this year, with the trend continuing into March 2010 toward $1,200 before a more serious correction takes place.
TREND ANALYSIS - Gold's breakout to a new all time high is a clear signal of further strong advances. The support trendline is at $1,000 and therefore fits in nicely with the elliott wave correction projection target. After the uptrend resumes this trendline is unlikely to be revisited until the second quarter of 2010.
SUPPORT / RESISTANCE - Resistance lies at the last high of $1071, Immediate support lies across the string of previous highs of $1033 and $1007, therefore there is very heavy support whilst very light resistance overhead, which again is suggestive of a mild correction in the current phase of the trend.
PRICE TARGETS - The measuring move off of the $681 2008 low projects all the way to $1,350, which looks set to be an achievable price during 2010. Nearer term immediate targets extend to $1,100 then $1,200.
MACD - The MACD indicator signaled a Gold breakout at $960, with a firm established uptrend. The current correction is inline with that of a mild correction within a strong uptrend.
SEASONAL TREND - There is a strong seasonal tendency for gold to rally from November through January i.e. for the next 3 months. This is suggestive that the current correction is living on borrowed time and may not last much longer.
Gold Conclusion
I started off this analysis skeptical of the prospects for gold given the 10 year bull run to date, but the price that is talking off the charts is pretty bullish! enough for me to consider accumulating a position. In the immediate future Gold appears to be targeting a continuing correction towards $1,000, after which it targets $1,200 by March 2010 and a price of $1,350 later during 2010.
Gold Long-term - Gold has broken out to a new high and it does look as though it is going much higher in the long run, there are multiple measuring moves that one can consider, such as 133%, 150%, 1.618% etc. However given the gap in time between the all time peaks, Gold of $2000 plus would now not surprise me.
Gold Bull Market Inter market Implication - Bearish on the U.S. Dollar.
Stocks Bull Market Forecast Update Into Year End
The update on the stocks bull market of early September called for a continuing trend towards a target range of 9,750 to 10,000 by late September / Early October to be followed by a correction in the region of 10% towards a target zone of 8,900 to 9,100, as illustrated below.
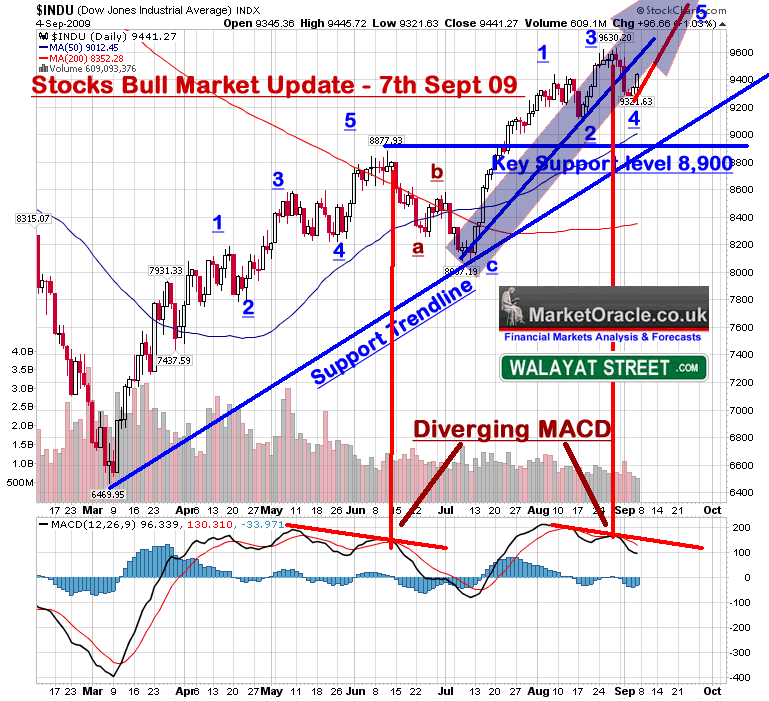
The market subsequently peaked in the middle of the target zone and began a correction which took the Dow down to 9,430.
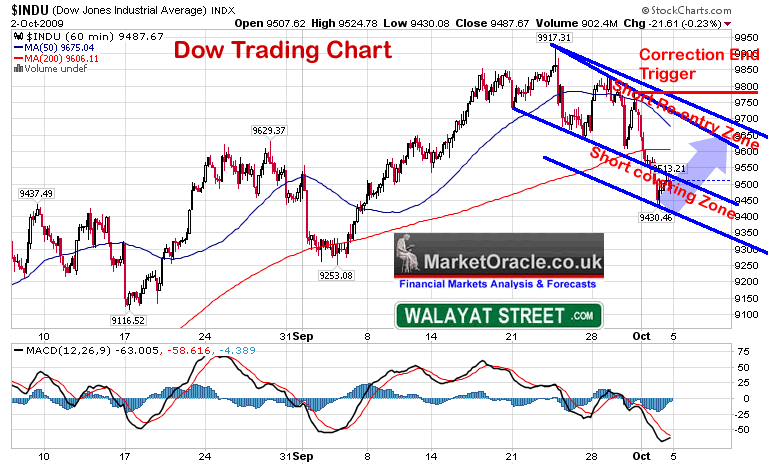
This was soon followed by surprisingly quick and powerful reversal to the upside that that lifted the Dow to above 10,000, peaking at 10,120. Readers of my weekly newsletters will know that I was skeptical of this phase of the bull market because it had not allowed both enough time and price to correct the preceding advance and therefore was not seen as being sustainable.
Bull market Re-cap - The stocks bull market that began in early March has so far from trough to peak advanced by 56% on the Dow against the preceding peak to trough decline of 54%. Those that refer to this as a bear market rally do not know what they are talking about as the rules have ALWASY remained the same in that a bull market is recognised by a 20% rally from a bear market low and a bear market is recognised by a 20% drop from a bull market peak. It is only that many analysts don't follow the rules! Instead much rather prefer to re-write history. THIS IS a STOCKS BULL MARKET, and when it will resolve into a bear market depends on when we next get a 20% confirming trigger ! (allowing for short-term whipsaws), so until I see such a definitive trigger the market will be treated as a bull market.
Stock Market Crash Again?
Forget swine flu, the pandemic doing the rounds is that of another Crash with the 1930's chart dusted down and presented as near fact of what is to transpire on every correction. However the markets response has so far always been to push to a new high for the move.
What happens to the crash calls ? They again get rolled out again on the NEXT correction! However the damage has been done as short stops are hit and losses accrued, that no broker will refund for the next crash call.
Stock Market Crash Calls
1. You CANNOT know with any reliability that the stock market is going to crash until AFTER it has actually peaked and entered a downtrend. Anyone that tells you a bull market pushing to new highs is going to crash is going to lose you all your money, as the market rallying significantly from the crash call NEGATES THAT CALL where trading is concerned, because any short positions enacted upon the call are stopped out!
2. You can only enter a Crash TRADE barely a day or hours before the crash event. Crash calls made weeks, months or years in advance are WORTHLESS where trading is concerned, and where investing is concerned, all investors should have stops on their positions based on technical considerations of where they would admit their analysis is wrong on a particular stock.
Crash calls are dangerous in that bring emotions into play which instead of staying focused on reacting to price action, adrenaline gets traders to commit to positions that will soon most probably bust their accounts where EVEN if the market eventually does CRASH, they will have been wiped out by the intervening rally SINCE the crash call! It is this fact that that is always forgotten.
Don't believe me ? Go check ALL of the hyped stock and other market crash calls that in actual fact WERE FOLLOWED by moves that would have wiped out REAL trades had those calls been acted up on.
In recent weeks I have been sharing a some of my trading ideas that I do not have the time to turn into a book -
- Get in Synch with the Market
- Forecasting and Trading
- The Holy Grail of Trading
- How to Learn to Trade
- Don't Think Too Much
Depression, What Depression ? - US GDP soared in the third quarter to 3.5%, yes, the rate of accent is probably NOT sustainable, but the debt fuelled bounce will continue a while before it peter's out into. The key point is as I pointed out in the analysis of October 2008. That we are NOT heading for another 1930's GREAT DEPRESSION, and therefore scrub the notion of following the 1930's chart pattern towards anything like a 90% stocks crash. So far the analysis is proving correct.
Good News Turns Bad - Stocks fell following strong US GDP data, which tells you that the market wants to head lower in the immediate future regardless of whether the news is good or bad, this supports the view that the market wants to break below the 9430 low.
Corporate Earnings - Corporate earnings have FOLLOWED the stock market higher, so what happened to the doomsayers of 6 months ago that repeatedly stated that corporate earnings forecasts implied stocks could NOT rally ?
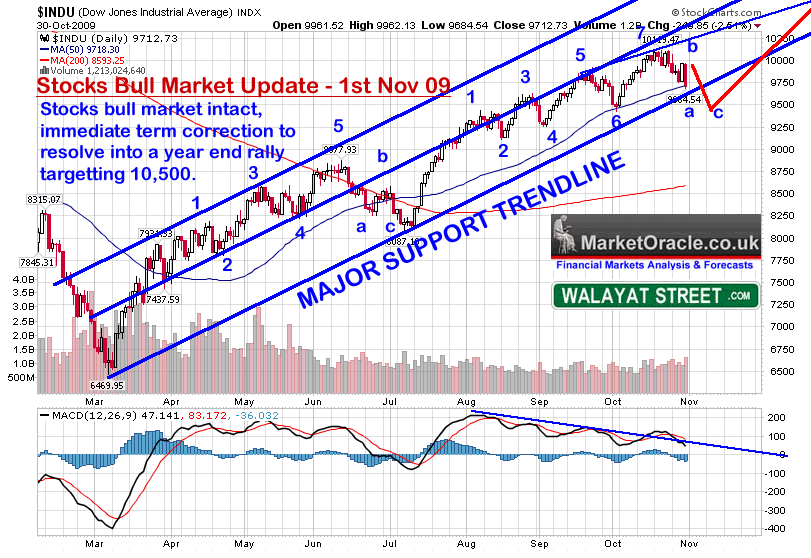
ELLIOTT WAVE THEORY - The elliott wave pattern is not clear, at best it resolves towards an ABC correction that sees an assault on 9430 and probable break.
TREND ANALYSIS - The Dow has now fallen to the major support trendline, which implies immediate term support, i.e. stocks 'should' rally here early next week. The question is will the trendline break or not ? Its a tough call but I would go with yes, which would target 9430. As you can also see the stock market is losing momentum as the last rally failed to reach the second trendline which is suggestive of a tougher trend into year end, though also implying that the market is not as overbought in terms of trend.
SUPPORT / RESISTANCE - Immediate minor support is at 9654, then the last low of 9430, 9250, then 9,100. Resistance over head is at 99,17, 9980 and 10120.
PRICE TARGETS - Downside price targets resolve into the 9100 to 9430 zone. Upside trendline projection implies 10,500 into December.
MACD - The MACD continues to show negative divergence to the price, though this has been ongoing since late August which implies an unraveling of the overbought state.
VOLUME - Volume has been WEAK during the rally, which contrary to much bearish commentary implies that this rally has NOT been bought into. So all of the talk of hyper bullishness is basically rubbish as there is no sign of such irrational exuberance in the volume, which remains heavier on the declines than the rallies and thus suggestive of selling rather than buying into the rally. Which is good behaviour for a stealth bull market.
SEASONAL TREND - There is a strong seasonal tendency for stocks to rally strongly during the months of November and December, following a weak September and October. The trend to date suggests right translation in the seasonal data i.e. pushed forward a month or so which implies that the trend into Mid November may be contrary to the seasonal tendency.
Stock Market Conclusion
There is nothing to suggest at this point in time that the stocks bull market is over which means that that corrections are for accumulating into, the overall trend is for stocks is to continue climbing a wall of worry whilst investors are scared by the vocal crash is coming crowd that will continue to re-write history to always be right in hindsight to again come out with more crash calls over the next few months as the Dow chart of the 1930's gets it's start / end date manipulated again so as to fit fresh crash calls.
The stocks bull market that has raged since the March low has fulfilled the original objective for a 50% advance, therefore upside for the next two months looks limited with greater risk of downside in the coming weeks though pending a break of the major support trendline which implies a rally in the immediate future. All in all this is suggestive of a downtrend towards 9,400 into Mid November with a year end rally to back above 10,000 targeting a rally high in the region of 10,350 to 10,500 during December.
Inter market Implications - Suggestive of a mild dollar rally, and a mild uptrend for commodities.
U.S. Dollar Bull Market Scenario Update
The most recent price action has seen the U.S. Dollar manage to hold onto USD 75 support that has propelled the dollar back through 76, however the trend over the past 2 months has been weak. The last update of the US Dollar bull market scenario of mid August 2009 called for a rally that targets USD 90 by the end of this year as long as 75 holds, as indicated by the original chart below :
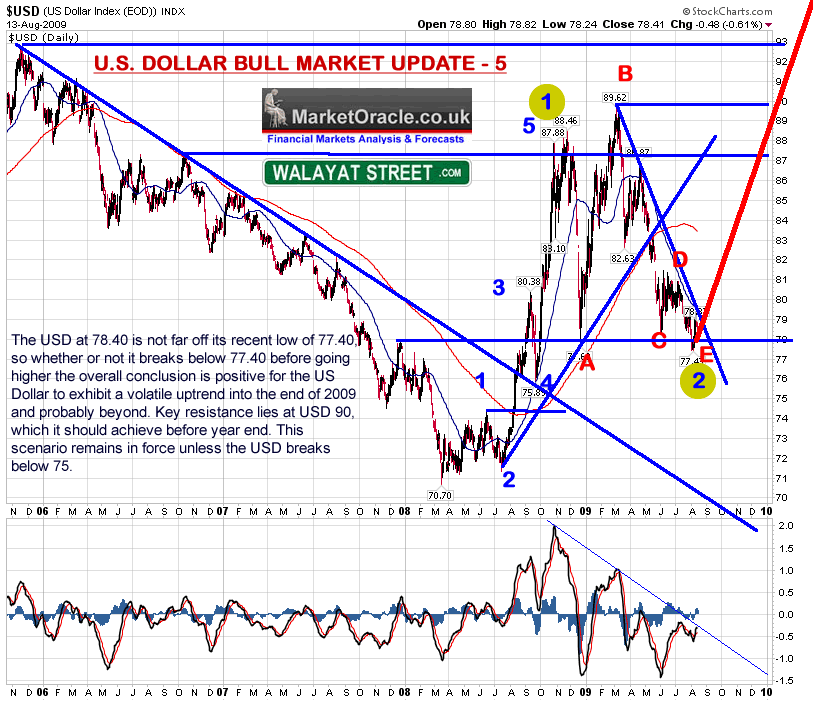
More analysts joining the Dollar bullish scenario- The bullish dollar scenario is increasingly being joined by more 'big named' analysts including Robert Prechter and then Mike Shedlock, though the U.S. Dollar in actually bottomed in March 2008 with the subsequent trend having deviated little from projections as the January 2009 update illustrated which a forecast sideways ABCDE trend into a late July low.
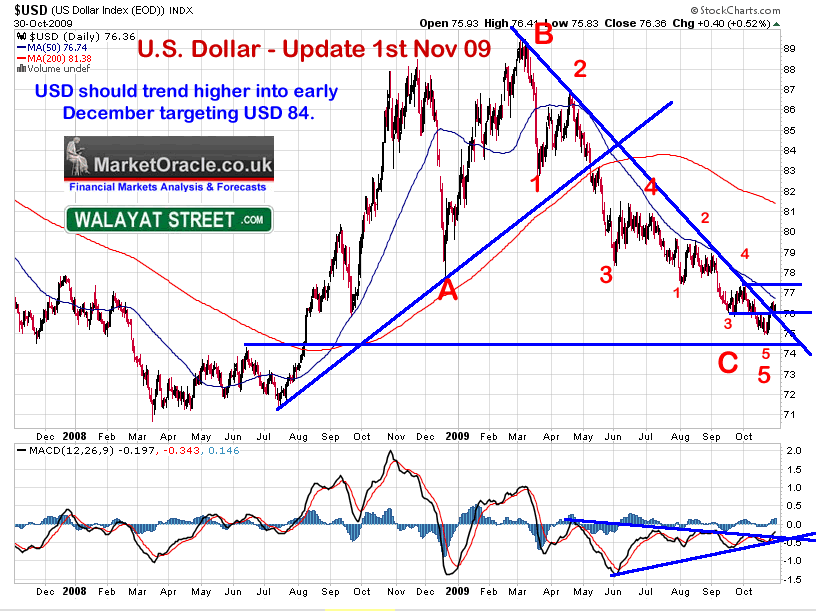
DEVIATION FROM THE FORECAST - The USD has under performed during the past 2 months which is a sign of weakness and therefore suggests upside action over the coming months will be limited with a far greater risk of downside breakdown then before, so signaling caution.
ELLIOTT WAVE THEORY - The elliott wave pattern nicely resolves to a ABC decline, with C wave comprised of 5 waves down to the recent low. With the USD at 76.36 it is therefore make or break time for this pattern which suggests that the low is in and therefore the trend should now be higher in terms of the wave pattern.
TREND ANALYSIS - USD has marginally breached the down trendline from the 89 high which is a positive, however it has yet to make a higher high which would require the USD to rally and close above 76.60, which is not too distant from the last close. However the trend of the past 3 months has generated much price action in the 76 to 81 range which means its going to be tough for the USD to overcome this and is suggestion of volatile price action.
SUPPORT / RESISTANCE - Immediate support is 75 a decided break of which would target 71. Near term key resistance is as 77.50. As mentioned above there is heavy overhead resistance which implies a volatile trend through it.
PRICE TARGETS - The USD has yet to give any confirming price triggers for the uptrend, the nearest of which is at 77.50. Therefore the USD is still in its downtrend until it manages to break above 77.50 that would target a push towards the 80-81 resistance area. A longer range target for the USD is now 84.
MACD - The MACD indicator is signaling a breakout to the upside for the USD, and is just about ready to give a higher high trigger on a further bounce from the up-trendline, so suggesting the current bounce is more significant than the preceding one from 76 to 77.50.
CYCLES - The recent price action puts the USD into the 2.5 cycle low time window, the question is, is the low a technical bounce or the start of a larger trend ?, but what it does suggest that the current trend has more upside the time, which it can spend either drifting sideways or push the USD through resistance.
SEASONAL TREND - The recent trend was inline with the seasonal tendency for the USD to weaken between August and October 2009, a continuation of which would suggest a strong November and a weak December.
USD Conclusion
The dollar trend has been much weaker than expected therefore this has to factor into the conclusion which now resolves to a much shallower uptrend than previously anticipated, however I do still expect an uptrend to materialise that now projects to a more conservative 84 to be hit during the remainder of this year, probably by early December.
Inter market Implications of a Stronger Dollar - Downward pressure on stocks and commodities priced in dollars such as gold. However as I have stated above competitive devaluation may not lead to any significant downward pressure, so we could yet see all three bull markets exhibit an upward bias over the coming few months.
Overall Inter market Conclusion
It looks like all three markets will manage to trend higher over the coming months, however given the technical pictures some are expected to perform stronger than others. I would put gold on the strongest footing then the dollar followed by stocks, of the three stocks present the biggest question mark at this point as the immediate future appears bearish. But given the last closing prices of Gold $1046, USD 76.36 and the Dow at 9,712, I would expect all three to be significantly higher by year end, which is contrary to the consensus view of the inter-market relationship between these markets.
Your analyst focused on commodities for out performance.
Source : http://www.marketoracle.co.uk/Article14697.html
By Nadeem Walayat
http://www.marketoracle.co.uk
Copyright © 2005-09 Marketoracle.co.uk (Market Oracle Ltd). All rights reserved.
Nadeem Walayat has over 20 years experience of trading derivatives, portfolio management and analysing the financial markets, including one of few who both anticipated and Beat the 1987 Crash. Nadeem's forward looking analysis specialises on the housing market and interest rates. Nadeem is the Editor of The Market Oracle, a FREE Daily Financial Markets Analysis & Forecasting online publication. We present in-depth analysis from over 400 experienced analysts on a range of views of the probable direction of the financial markets. Thus enabling our readers to arrive at an informed opinion on future market direction. http://www.marketoracle.co.uk
Disclaimer: The above is a matter of opinion provided for general information purposes only and is not intended as investment advice. Information and analysis above are derived from sources and utilising methods believed to be reliable, but we cannot accept responsibility for any trading losses you may incur as a result of this analysis. Individuals should consult with their personal financial advisors before engaging in any trading activities.
Nadeem Walayat Archive |
© 2005-2022 http://www.MarketOracle.co.uk - The Market Oracle is a FREE Daily Financial Markets Analysis & Forecasting online publication.


