


Stock Market Down Draft Warning
Stock-Markets / Stock Index Trading Nov 01, 2009 - 04:26 AM GMTBy: Guy_Lerner

 Since October 10, I have been singing a new tune and warning that "there is probably greater risk of a market down draft now than in past weeks," and on October 17, I even underlined these words for emphasis. I think this past week's high volume selling would qualify as a market down draft.
So let me take a momentary bow and then quickly get back to business here because as we all know, hubris in the market is rarely rewarded. I couldn't resist the opportunity to pat myself on the back, which means I am putting myself at risk for being kicked in the ass by the market. Some might even argue that even a broken clock is right twice day. I say let them argue. I will continue to put out data driven research that can be acted upon in a timely and profitable manner.
The real question market participants want to know is this: is last week's dousing of the bullish spirits just a bump in the road on the way to higher prices or are the wheels coming completely off the rally which will lead to much lower prices?
I vote for option #3 at least in the short term, and option #3 is really what I have been stating for the last month:
"Equities are for renting not owning at this juncture. I am not calling for a market top, but prices should trade more in a range, and if you intend to play on the long side, it will be important to maintain your discipline (for risk reasons) and buy at the lows of that trading range and sell at the highs to extract any profits from this market. The upward bias still remains as long as investor sentiment is still extremely bullish, but there is probably greater risk of a market down draft now than in past weeks."
The ascent of the rally clearly has slowed over the last 8 weeks, but predicting that was the easy part. Whether we go sideways or much, much lower from here is a bit more difficult to say. We know that the excesses in bullish sentiment still need to be unwound, which suggests more downside to come. How else do you convert bulls to bears other than lower prices? As always, timing this possible descent is a little more problematic as the major indices (S&P500, NASDAQ 100, and Dow Jones Industrials) are only at the bottoms of rising trend channels. The Russell 2000 has broken below its rising trend channel, and maybe this is sign that the speculative fervor of this rally is over. In any case, with positive seasonal tendencies kicking in and prices still within an uptrend a bounce seems likely.
Overall, the sentiment data remains neutral to bullish, which is a bearish signal for the markets until these excesses are unwound. The trading range persists; we are at the bottom of that trading range. The market is still prone to sudden sell offs as we saw this past week.
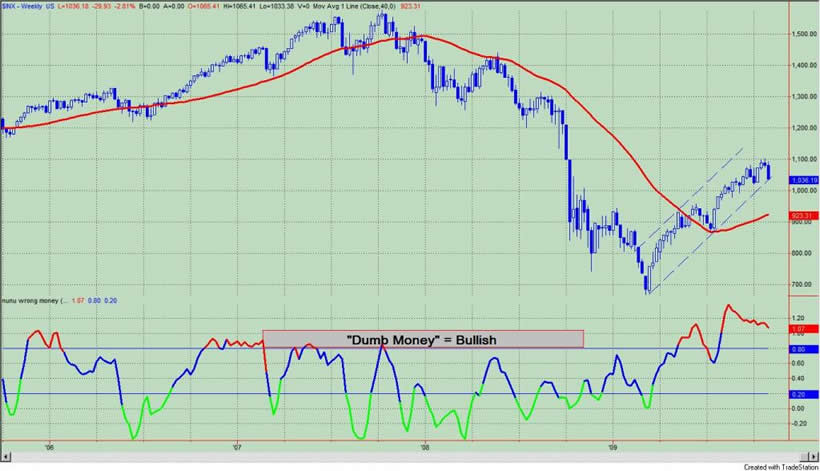
The "Dumb Money" indicator, which is shown in figure 1, looks for extremes in the data from 4 different groups of investors who historically have been wrong on the market: 1) Investor Intelligence; 2) Market Vane; 3) American Association of Individual Investors; and 4) the put call ratio. The "Dumb Money" indicator shows that investors are extremely bullish.
Figure 1. "Dumb Money" Indicator/ weekly
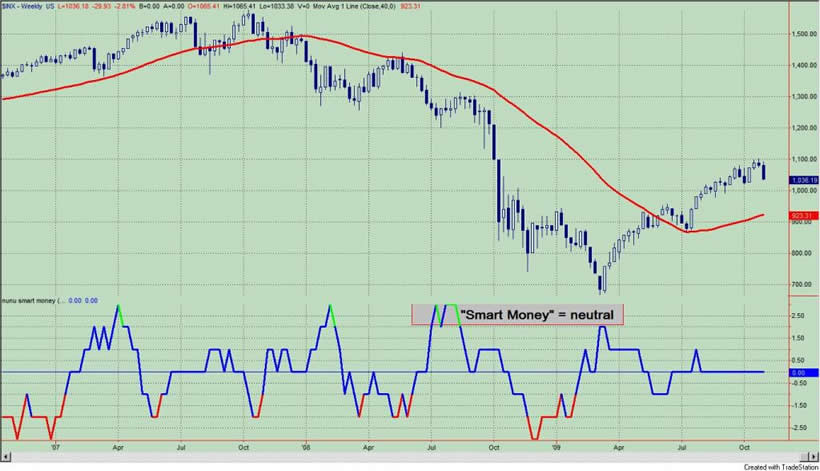
The "Smart Money" indicator is shown in figure 2. The "smart money" indicator is a composite of the following data: 1) public to specialist short ratio; 2) specialist short to total short ratio; 3) SP100 option traders. The "smart money" is neutral.
Figure 2. "Smart Money" Indicator/ weekly
Company insiders continue to sell shares to an extreme degree. See figure 3, a weekly chart of the S&P500 with the Insider Score "entire market" value in the lower panel.
Figure 3. InsiderScore Entire Market/ weekly
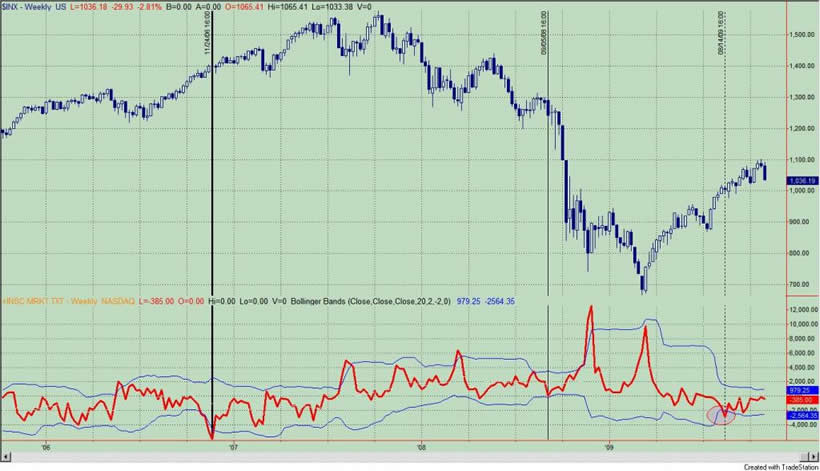
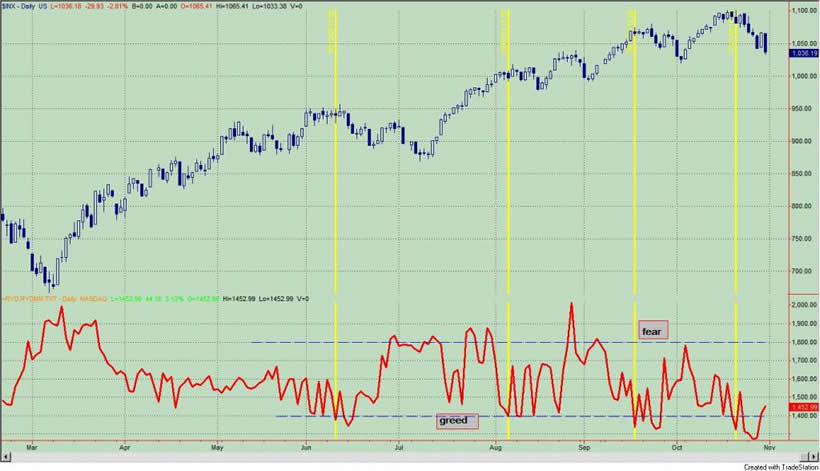
Figure 4 is a daily chart of the S&P500 with the amount of assets in the Rydex Money Market Fund in the lower panel. When the money market fund is flush with cash, one can assume that the Rydex timers (like market participants in general) are fearful of market losses. From a contrarian perspective, these are good buying opportunities. When the amount of assets are low (like now), these market timers are all in; one should be on the lookout for market tops. There is little buying power left. As of Friday's close, assets in the money market fund remain low, but they are off the levels seen earlier in the week.
Figure 4. Rydex Money Market/ daily
By Guy Lerner
http://thetechnicaltakedotcom.blogspot.com/
Guy M. Lerner, MD is the founder of ARL Advisers, LLC and managing partner of ARL Investment Partners, L.P. Dr. Lerner utilizes a research driven approach to determine those factors which lead to sustainable moves in the markets. He has developed many proprietary tools and trading models in his quest to outperform. Over the past four years, Lerner has shared his innovative approach with the readers of RealMoney.com and TheStreet.com as a featured columnist. He has been a regular guest on the Money Man Radio Show, DEX-TV, routinely published in the some of the most widely-read financial publications and has been a marquee speaker at financial seminars around the world.
© 2009 Copyright Guy Lerner - All Rights Reserved
Disclaimer: The above is a matter of opinion provided for general information purposes only and is not intended as investment advice. Information and analysis above are derived from sources and utilising methods believed to be reliable, but we cannot accept responsibility for any losses you may incur as a result of this analysis. Individuals should consult with their personal financial advisors.
Guy Lerner Archive |
© 2005-2022 http://www.MarketOracle.co.uk - The Market Oracle is a FREE Daily Financial Markets Analysis & Forecasting online publication.