


Modified Marc Faber Stock Market Sell Signal Model, More Insights
Stock-Markets / Trading Systems Oct 30, 2009 - 01:51 AM GMTBy: Guy_Lerner

 As the prior post shows, we can improve a simple moving average strategy by going to cash when the trends in gold, crude oil, and yields on the 10 year Treasury are strong.
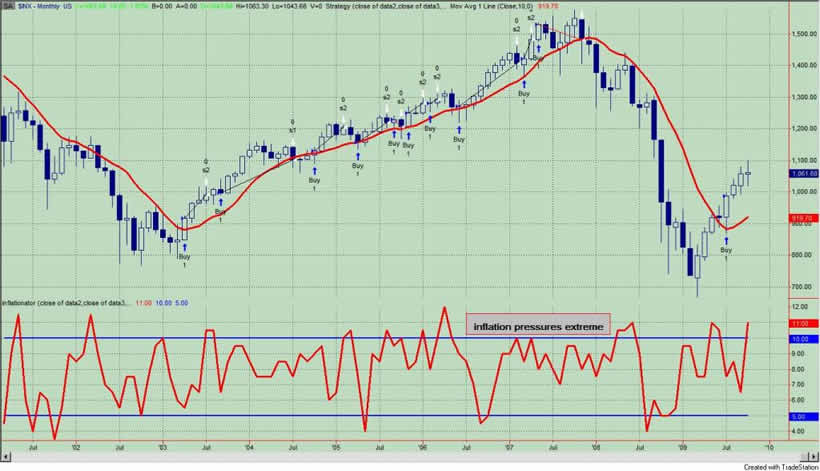
But for fun and education, let's pretend that the only time you are in the market is when the S&P500 is above its simple 10 month moving average and when our composite indicator that measures the trends in gold, crude oil, and yields on the 10 year Treasury is above the upper extreme line. This would represent the current market situation. See figure 1.
Figure 1. S&P500/ monthly
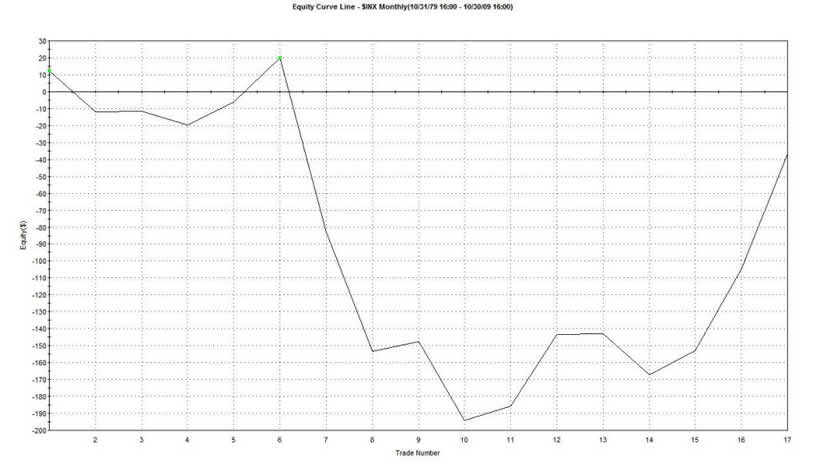
Going back to 1987, there have been 17 such occurrences. 11 were profitable. Your time in the market was about 15%. Such a strategy did not make money, and yielded the following equity curve. See figure 2. Clearly, this is not a favorable investing environment.
Figure 2. Equity Curve
Now let's look at the maximum favorable excursion graph or MFE. MFE measures how far a trade moves in your favor after you put it on and before it is closed out. See figure 3 for the strategy's MFE graph.
Figure 3. Strategy MFE
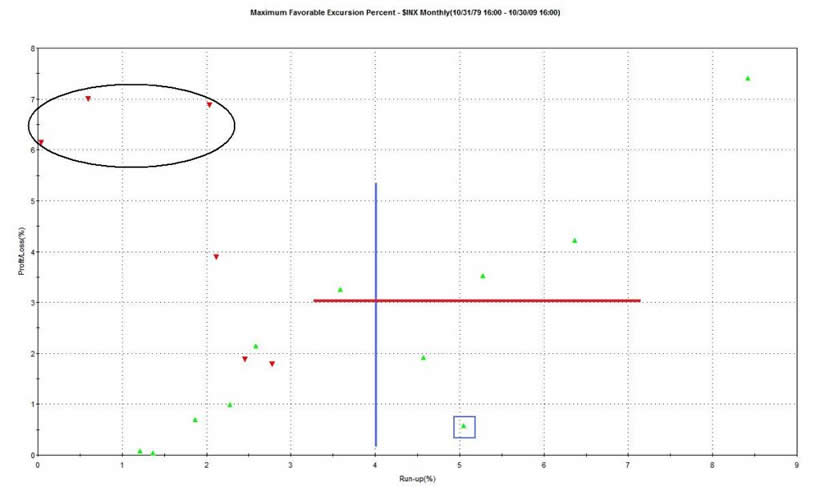
Look at the caret within the blue box. This represents one trade. This trade had an MFE or gain of 5% (x axis) before being closed out for a 0.5% winner (y axis). We know it was a winning trade because it is green caret. Of the 17 trades, 5 had MFE's greater than 4%; this is to the right of the blue vertical line. Only 4 of the trades had final gains of greater than 3%; this is above the red horizontal line. 3 of the trades (in the upper left corner of the graph, oval) had losses greater than 6%.
My interpretation of all this data is that this is not a particularly dynamic time to be investing. There appears to be a greater chance of losing money than winning. If a trade had an MFE greater than 3% it was likely to be profitable.
Overall, I still stand by the original assertion that stocks tended to under perform during times when the trends in gold, commodities, and yields on the 10 year Treasury bond are strong.
By Guy Lerner
http://thetechnicaltakedotcom.blogspot.com/
Guy M. Lerner, MD is the founder of ARL Advisers, LLC and managing partner of ARL Investment Partners, L.P. Dr. Lerner utilizes a research driven approach to determine those factors which lead to sustainable moves in the markets. He has developed many proprietary tools and trading models in his quest to outperform. Over the past four years, Lerner has shared his innovative approach with the readers of RealMoney.com and TheStreet.com as a featured columnist. He has been a regular guest on the Money Man Radio Show, DEX-TV, routinely published in the some of the most widely-read financial publications and has been a marquee speaker at financial seminars around the world.
© 2009 Copyright Guy Lerner - All Rights Reserved
Disclaimer: The above is a matter of opinion provided for general information purposes only and is not intended as investment advice. Information and analysis above are derived from sources and utilising methods believed to be reliable, but we cannot accept responsibility for any losses you may incur as a result of this analysis. Individuals should consult with their personal financial advisors.
Guy Lerner Archive |
© 2005-2022 http://www.MarketOracle.co.uk - The Market Oracle is a FREE Daily Financial Markets Analysis & Forecasting online publication.