


Stocks Almost at the End of the Rally Pattern
Stock-Markets / Stocks Bear Market Oct 27, 2009 - 06:24 AM GMTBy: Graham_Summers

 Do you see the rising bear?
I’ve show the below bearish rising wedge to my readers several times. If you’re unfamiliar with this chart pattern, it occurs when the trading range shrinks as stocks rise higher. Typically these patterns precede SHARP moves downward. For that reason it’s extremely important to note when they occur.
And we’ve got a doozy of one forming right now.
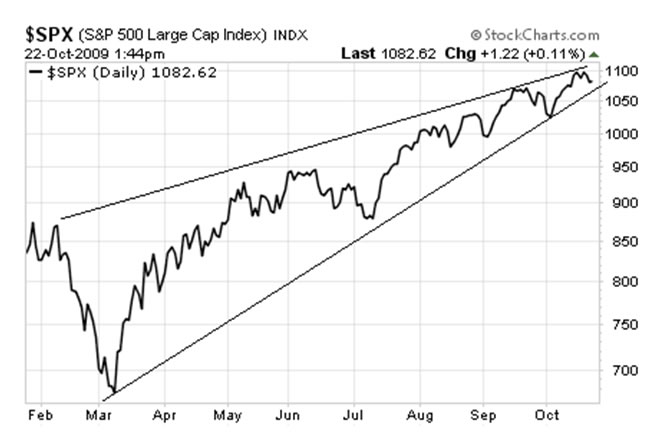
I now want to draw your attention to a close-up of the last three months’ action:
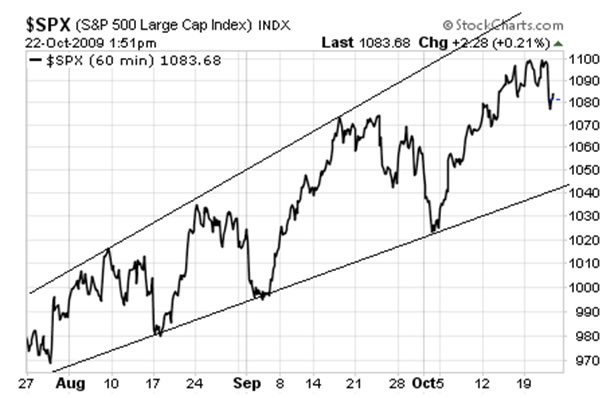
As you can see, stocks have begun forming an expanding wedge pattern WITHIN the bearish rising wedge we’ve been tracking.
I’ve been forewarning of a potential Crash for months now. And the market’s current action is PRECISELY what you would expect for a MAJOR top (increased volatility).
It also gives us a great potential target for when things might get ugly: whenever stocks finally break below this expanding pattern (currently the lower end of the range is 1,045 on the S&P 500).
The issue now is whether this rally gives up this week, rolls over and breaks below the trend line… or if there will be some greater push to the upside. The below chart gives us some clues as to what may happen next:
I’ve annotated the technical resistance lines for the S&P 500 in black. They are 1,000 (we’ve broken), 1,100 (we’ve tested) and 1,200 (we’re not there yet). I’ve also laid out the Fibonacci retracements based on the S&P 500’s collapse in March (see the red lines).
If you’re not familiar with Fibonacci retracements, they act on the belief that the stock market (like many elements in the natural, economic, and artistic worlds) follows the famed Fibonacci sequence. However, when it comes to the stock market, the idea is that the market typically collapses or rallies a % that falls in line with this sequence (for example 38.2%, 50%, 61.8%).
As you can see in the above chart, for today’s rally started in March 2009, the 50% retracement on the S&P 500 is at 1,121. The 61.8% retracement is 1,228. As silly as this may sound on the surface, these levels could prove to be decisive turning points (you’d be amazed how many times the market has rolled over or rallied to test a Fibonacci retracement). I would posit we will see the ULTIMATE SELL come at the 61.8% retracement level (1,228 on the S&P 500).
On the other hand, given the recent jump in the dollar we may be about to see a very serious fall in stocks sooner rather than later. Keep your eye on the lower end of the S&P 500’s trendline. When it breaks, bad times are coming fast.
I’m already preparing investors for what’s to come with a FREE Special Report detailing THREE investments that will explode when stocks start finally collapse. While most investors are complacently drifting towards the next Crisis lke lambs to the slaughter, my readers are already getting ready with my Financial Crisis “Round Two” Survival Kit.
The investments detailed within this report will not only protect your portfolio from the coming carnage, they’ll also show you enormous profits: they returned 12%, 42%, and 153% last time stocks collapsed.
Swing by www.gainspainscapital.com/roundtwo.html to pick up a FREE copy today!
Good Investing!
Graham Summers
Graham Summers: Graham is Senior Market Strategist at OmniSans Research. He is co-editor of Gain, Pains, and Capital, OmniSans Research’s FREE daily e-letter covering the equity, commodity, currency, and real estate markets.
Graham also writes Private Wealth Advisory, a monthly investment advisory focusing on the most lucrative investment opportunities the financial markets have to offer. Graham understands the big picture from both a macro-economic and capital in/outflow perspective. He translates his understanding into finding trends and undervalued investment opportunities months before the markets catch on: the Private Wealth Advisory portfolio has outperformed the S&P 500 three of the last five years, including a 7% return in 2008 vs. a 37% loss for the S&P 500.
Previously, Graham worked as a Senior Financial Analyst covering global markets for several investment firms in the Mid-Atlantic region. He’s lived and performed research in Europe, Asia, the Middle East, and the United States.
© 2009 Copyright Graham Summers - All Rights Reserved
Disclaimer: The above is a matter of opinion provided for general information purposes only and is not intended as investment advice. Information and analysis above are derived from sources and utilising methods believed to be reliable, but we cannot accept responsibility for any losses you may incur as a result of this analysis. Individuals should consult with their personal financial advisors.
Graham Summers Archive |
© 2005-2022 http://www.MarketOracle.co.uk - The Market Oracle is a FREE Daily Financial Markets Analysis & Forecasting online publication.