


Gold Trading, Playing the Moving Average and Momentum Ratios
Commodities / Gold & Silver 2009 Oct 27, 2009 - 01:57 AM GMTBy: John_Winston

 For those enamored of the current bullish moves in the Gold market, there’s still plenty of reason the believe that the yellow Gold bus has more than enough gas in its tank to make the trip up to the next important Fibonacci extension ratio without too much difficulty.
Gold momentum Trading Newsletter Chart
Really, when you stop to think about it we all tend to make the practice of successful trading and investment harder than it really needs to be; we apply dozens of conflicting indicators and then listen to too many different points of view, and then wonder why we’ve become powerless to choose just which side of the market to be on. Sound familiar? It should, because if we’re all honest about it, everyone who’s ever traded and invested for any length of time has probably found themselves mired in a similar situation, one in which confusion and fear overshadows sound logic, long-term fundamentals and high probability patterns of momentum, support and resistance. So let’s simplify things a bit, right here, right now, starting with this easy-to-decipher weekly chart of the cash Gold market.
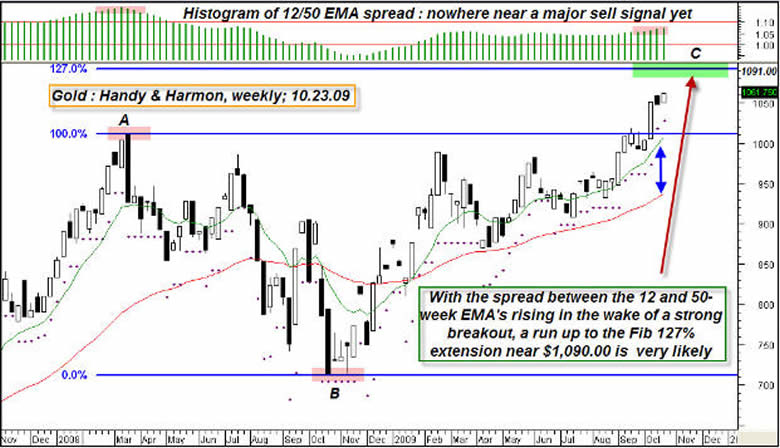
Glancing at he chart above, we see three easy-to-understand chart dynamics at work, as follows:
1.) Gold has successfully broken above a significant swing high, the one made in March 2008.
2.) The spread between the 12 week and 50 week exponential moving averages (EMA’s) is widening, implying increased momentum.
3.) The A-B-C swing dynamics (with point ‘A’ being a major swing high and point ‘B’ being a major swing low) are suggesting that Gold will continue up to meet the Fibonacci 127% extension price near $1,091.00.
None of these technical aspects is especially significant in and of itself, but when all three are combined and the ‘big picture’ view takes center stage, these three unique chart dynamics work together to paint a very bullish near-term future for the price of cash Gold. It’s also helpful for Gold Bugs to note that Gold hasn’t broken down (in percentage terms) to the same extent as have the broad US stock indexes, such as the Russell 2000 index and the S&P 500 index, each of which are off by more than 5% from their respective post-crash 2009 highs as of this writing. In fact, at some point in this ongoing Gold bull market, we may very well see the price of Gold completely de-couple from any semblance of correlated movement with the broad stock market indexes, as investor concerns over inflation and dollar devaluation trump all other considerations. And even a small percentage of money pulled from the stock market – subsequently re-invested in the Gold market – could make such a ‘de-coupling’ an event worthy of notice by millions of investors, worldwide.
For those investors who may be wary of putting large sums of cash to work right now in the Gold market, here’s a possible way for you to dip your toes into the water without fear of getting in too far over your head. First off, if you believe that the current Gold bull market is a generational event, one destined to run higher for another five years or more, then why not consider putting a modest ‘core’ position to work now, one that you’ll hold for the remainder of the bull market? Then if the price continues higher, you can be glad that you didn’t miss the boat entirely. If prices pullback somewhat, you’ll be happy that you didn’t buy too much of a core position even as you re-evaluate the long-term technicals and fundamentals, to see if putting on additional trading or investing positions is a wise course of action. The future is unknowable, for the most part, so taking an ‘easy does it’ course of action at this point might be just the ticket for those who are late to board the eight-year run in the Gold market. For those already long Gold, keep an eye on that 12/50 weekly EMA spread; with Gold looking as if the Fib 127% price level at $1,091.00 could act as a defacto ‘price magnet’, an ever-widening spread will be the tip-off that Gold intends to hit that 127% retracement price sooner rather than later.
If you would like to receive Free Gold Analysis please visit my site: www.TechnicalCommodityTrader.com
By John Winston
John Winston is the technical commodity trader analyst. He provides detailed technical analysis for popular commodities like gold, silver, copper, oil, and natural gas. By focusing strictly on these commodity price movements trading become strictly technical and simple to trade. His free trading reports are available at his website: www.TechnicalCommodityTrader.com
Contact John at: Info [@] TechnicalCommodityTrader.com
© Copyright John Winston 2009
Disclaimer: The above is a matter of opinion provided for general information purposes only and is not intended as investment advice. Information and analysis above are derived from sources and utilising methods believed to be reliable, but we cannot accept responsibility for any losses you may incur as a result of this analysis. Individuals should consult with their personal financial advisors.
© 2005-2022 http://www.MarketOracle.co.uk - The Market Oracle is a FREE Daily Financial Markets Analysis & Forecasting online publication.