Stock Market Fun, Pi, Phi and Armstrong Cycle
Stock-Markets / Cycles Analysis Oct 26, 2009 - 01:58 PM GMTBy: Forkoholic_Serge
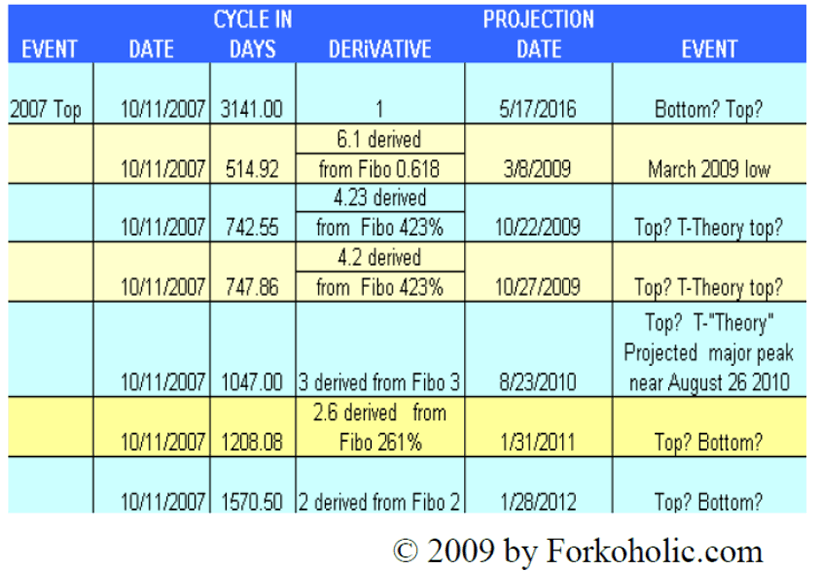
Fun with market dates! I was reading Marty Armstrong today and decided to play with his 8.6 year cycle—3141 days to be exact.
Lets start our count from October 11th 2007 top.
Quick spreadsheet reveals interesting dates: 3141/6.1 where 6.1 is derivative of 0.618 gets us March 09,2009 low! Wow! Playing with 4.2 & 4.23 gets us 10/22 and 10/27 dates—a top perhaps? T-Theory top as well?
Dividing 3141 by 3 gets us August 23, 2010 which is very close to T-Theory’s August 26th top prediction and than there’s a 5/17/2016—a top? a bottom? We shall see :) Just having fun with numbers!
Enjoy & good trading to you!
- Forkoholic Serge -

Services provided at EWF:
- Daily US Market UPdate. Released every trading day, after 6pm EST/3pm PST.
This full report consists of 3 parts: 1) Daily market commentary, pitchfork
analysis, Elliott Wave count on $SPX 2) Daily interpolated market
projections for
$SPX, Dow, NASDAQ, NDX, RUT. 3) State of Indicators Daily (SID) Report - 12 of
EWF's favorite indicators, some are proprietary.
- CSI:Wall Street. Chart Scene Investigation - Monthly Newsletter with
focus on medium term US market projections
- Market Vibrations Report is Change In Trend Calendar, Monthly Mega Report
containing state of the art Timing Techniques for US & International
Markets S&P500, NASDAQ, Dow based on Fibonacci, Lucas, Gann trading &
calendar Days,
Spiral Dates and Golden Ratio.
- Individual reports "Fork & Fractal Report" for 3 of your favorite
stocks. Visit our
main website
http://www.Forkoholic.com
Club site preview
http://sites.google.com/site/ewfclubpreview/
© 2005-2022 http://www.MarketOracle.co.uk - The Market Oracle is a FREE Daily Financial Markets Analysis & Forecasting online publication.


