Equity Markets Ignore Rising Oil Prices
Stock-Markets / Global Stock Markets Jul 03, 2007 - 01:04 AM GMTBy: Mike_Paulenoff
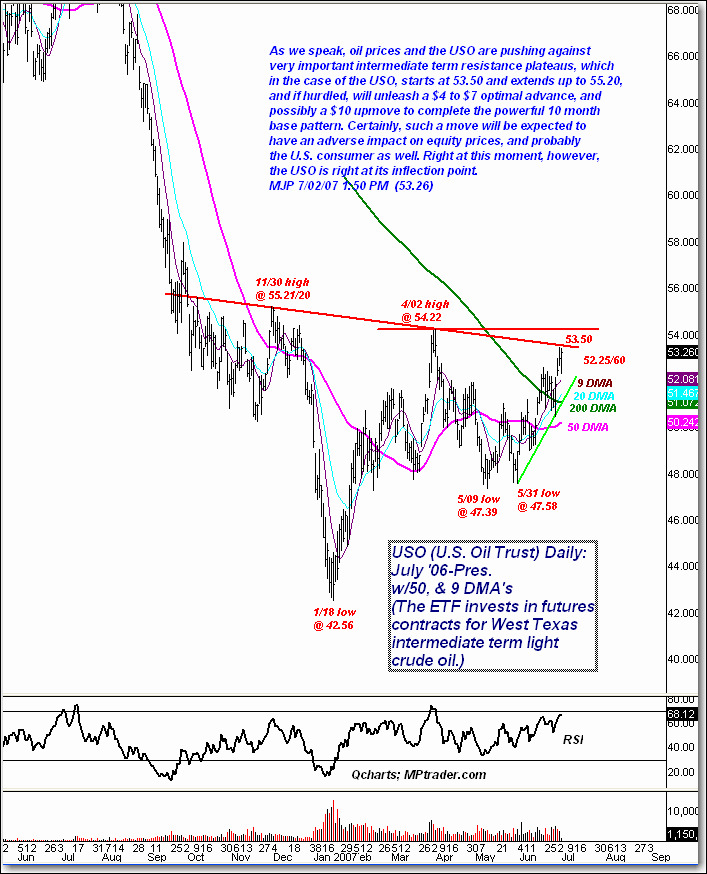
 Oil has been making an impressive move this past month. As seen through the chart of its ETF the U.S. Oil Trust (USO), oil is pushing against very important intermediate-term resistance plateaus. This starts at 53.50 in the USO and extends up to 55.20. If hurdled, it will unleash a $4 to $7 optimal advance and possibly a $10 upmove to complete the powerful 10-month base pattern.
Certainly, such a move will be expected to have an adverse impact on equity markets and probably the U.S. consumer as well, as it will be difficult for equity bulls to avoid taking protective measures. Right this moment, however, the equity markets are completely ignoring the upmove in the energy complex, and the USO is right at its inflection point.

Perhaps we should view the oil price climb in the context of the sharp decline in longer-term interest rates.
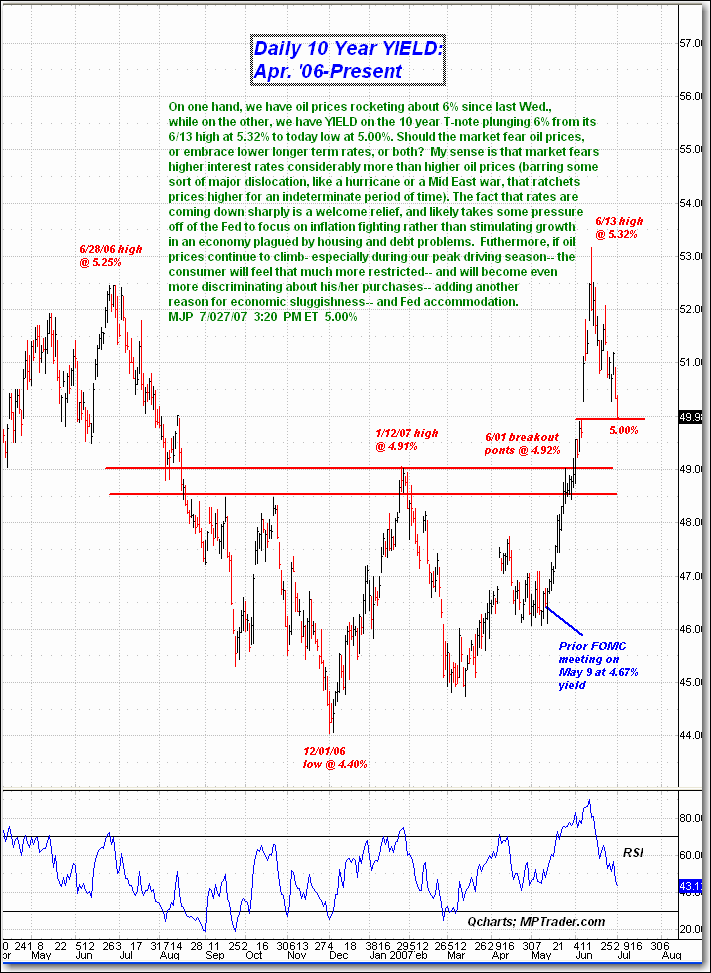
Looking at the 10-year T-note Yield, on the one hand we have oil prices rocketing about 6% since last Wednesday, while on the other we have yield on the 10-year T-note plunging 6% from its 6/13 high at 5.32% to todayÕs low at 5.00%. Should the market fear oil prices, or embrace lower longer-term rates, or both?
My sense is that the market fears higher interest rates considerably more than higher oil prices (barring some sort of major dislocation, like a hurricane or a Mid-East war, that ratchets prices higher for an indeterminate period of time). The fact that rates are coming down sharply is a welcome relief, and likely takes some pressure off of the Fed to focus on inflation fighting rather than stimulating growth in an economy plagued by housing and debt problems.
Furthermore, if oil prices continue to climb, especially during our peak driving season, the consumer will feel that much more restricted and become even more discriminating about his or her purchases, adding another reason for economic sluggishness Ð and Fed accommodation.

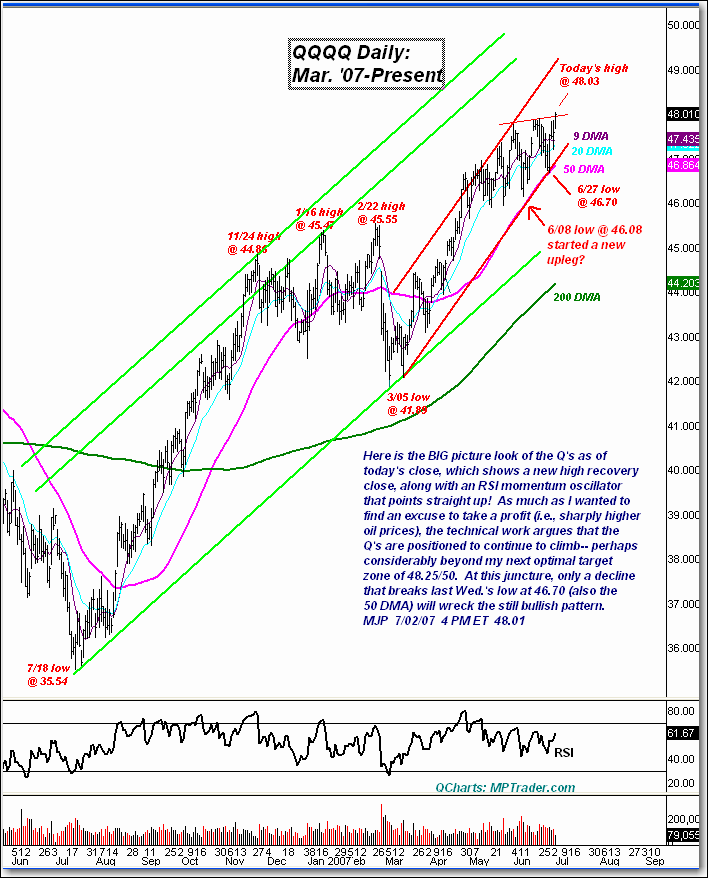
For now though, it appears to be one big liquidity party going on... again. So, let's enjoy it while it lasts. IÕll leave you with a big-picture of the QÕs (QQQQ), which have been unrelenting in their rally.
The QÕs enjoyed a new high recovery close today, along with an RSI momentum oscillator that points straight up! As much as I wanted to find an excuse to take a profit (i.e., sharply higher oil prices), the technical work argues that the QÕs are positioned beyond my next optimal target zoe of 48.25/50. At this juncture, only a decline that breaks last WednesdayÕs low at 46.70 (also the 50 DMA) will wreck the still bullish pattern.

Sign up for a free 15-day trial to Mike's ETF Trading Diary today.
By Mike Paulenoff
Mike Paulenoff is author of the MPTrader.com (www.mptrader.com) , a real-time diary of Mike Paulenoff's trading ideas and technical chart analysis of Exchange Traded Funds (ETFs) that track equity indices, metals, energy commodities, currencies, Treasuries, and other markets. It is for traders with a 3-30 day time horizon, who use the service for guidance on both specific trades as well as general market direction
© 2002-2007 MPTrader.com, an AdviceTrade publication. All rights reserved. Any publication, distribution, retransmission or reproduction of information or data contained on this Web site without written consent from MPTrader is prohibited. See our disclaimer.
Mike Paulenoff Archive |
© 2005-2022 http://www.MarketOracle.co.uk - The Market Oracle is a FREE Daily Financial Markets Analysis & Forecasting online publication.


