


Are You Watching This Stock Market Divergence?
Stock-Markets / Stock Index Trading Oct 19, 2009 - 08:07 AM GMTBy: Marty_Chenard

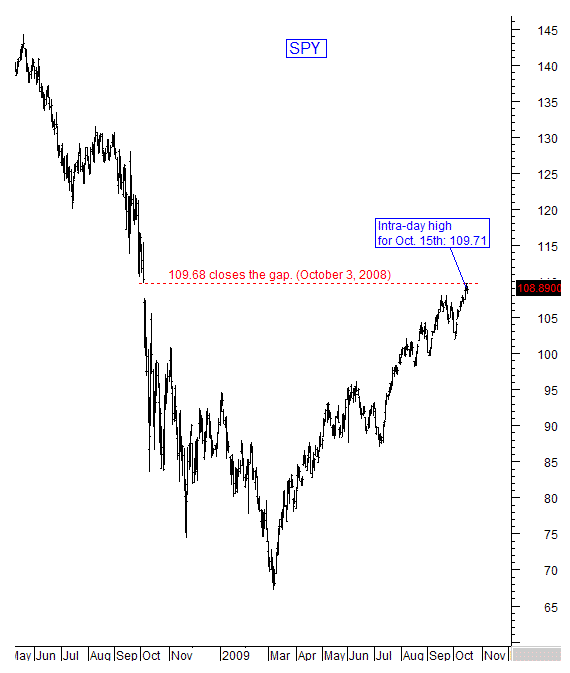
 It was just a little over 1 year ago, October 3rd of 2008, when the SPY gapped down sharply. That gapped remained unclosed until last Thursday.
On Friday, the SPY had pulled back slightly and it closed at 108.89.
What does this all mean?
It means that the 109.68 level is now a major resistance point. Keep an eye on what happens here, because the SPY will need to move past 109.68 to continue its rally. This is a critical test level to watch in the next few days.
Oh yes, there is one more thing you should watch ... see today's second chart ...
What is the other thing to watch?
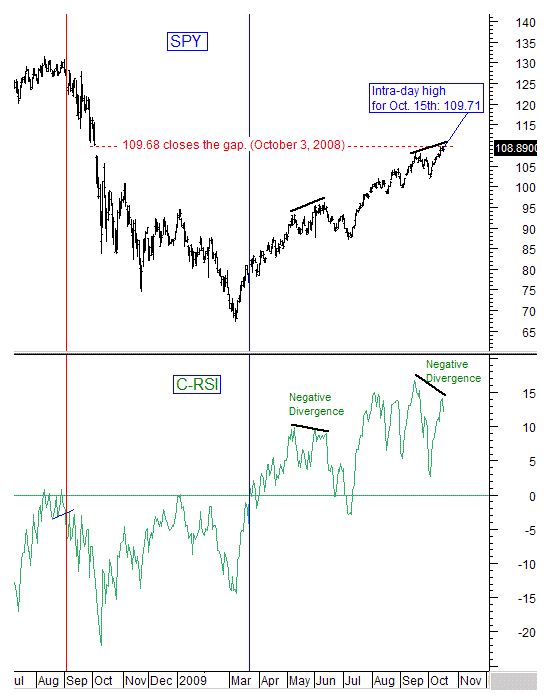
The SPY's Relative Strength. In the chart below, we plotted our C-RSI for a 30 day period. The C-RSI is not mystical, it is simply the standard RSI indicator minus 50 so that zero becomes the signal line. (You can't find the C-RSI any place else, as this is just something we do to make the RSI easier to read and interpret.)
So, here is what is going on: The C-RSI is still positive so that is a good thing. However, as the SPY moved up to test the 109.68 level, the Relative Strength dropped. In other words, the SPY made it up to the test level, but with less strength. In technical analysis terms, it is referred to as a "negative divergence".
Negative divergences are warning signs. In this case, a continuation for the SPY to move up while strength continues to decrease would end in an unsustainable condition.
** Feel free to share this page with others by using the "Send this Page to a Friend" link below.
By Marty Chenard
http://www.stocktiming.com/
Please Note: We do not issue Buy or Sell timing recommendations on these Free daily update pages . I hope you understand, that in fairness, our Buy/Sell recommendations and advanced market Models are only available to our paid subscribers on a password required basis. Membership information
Marty Chenard is the Author and Teacher of two Seminar Courses on "Advanced Technical Analysis Investing", Mr. Chenard has been investing for over 30 years. In 2001 when the NASDAQ dropped 24.5%, his personal investment performance for the year was a gain of 57.428%. He is an Advanced Stock Market Technical Analyst that has developed his own proprietary analytical tools. As a result, he was out of the market two weeks before the 1987 Crash in the most recent Bear Market he faxed his Members in March 2000 telling them all to SELL. He is an advanced technical analyst and not an investment advisor, nor a securities broker.
Marty Chenard Archive |
© 2005-2022 http://www.MarketOracle.co.uk - The Market Oracle is a FREE Daily Financial Markets Analysis & Forecasting online publication.