


Stocks Primary Bear Trend About to Resume?
Stock-Markets / Stocks Bear Market Oct 16, 2009 - 04:21 AM GMTBy: Brian_Bloom

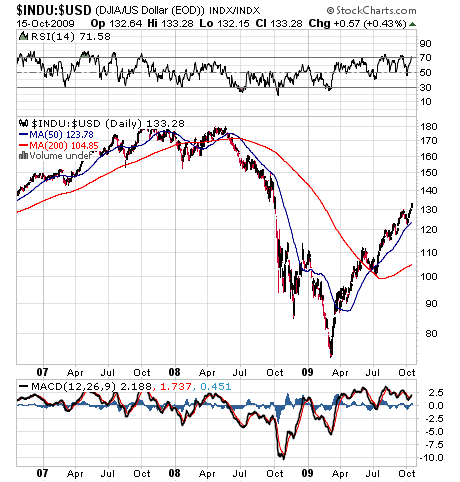
 The chart below looks like it’s headed for overbought territory on the RSI and it the falling tops on the MACD seem to be signaling that the ratio might be about to pull back. By implication, either the Dow can be expected to pull back or the dollar index can be expected to rise, or both.
The chart below (courtesy stockcharts.com) is of the Dow Jones Industrial Index divided by the US$ Index
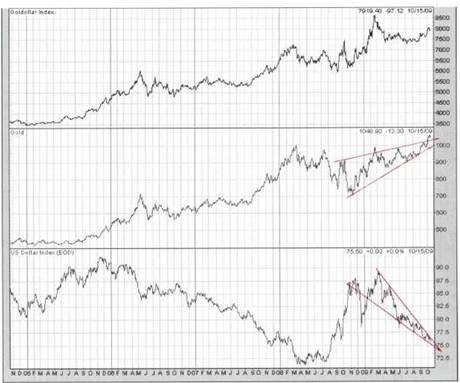
The chart below (courtesy DecisionPoint.com) shows signs of both the dollar and gold reaching the apex of wedges. The analyst has taken some liberty in drawing the trend lines on the gold wedge to maximize the points of contact on the upper line. Similarly, on the lower line on the dollar wedge the number of points of contact has been maximized. Gold “may” be showing a false breakout (not necessarily – see below) and the dollar may be getting closer to an upside bounce (not necessarily, see below).
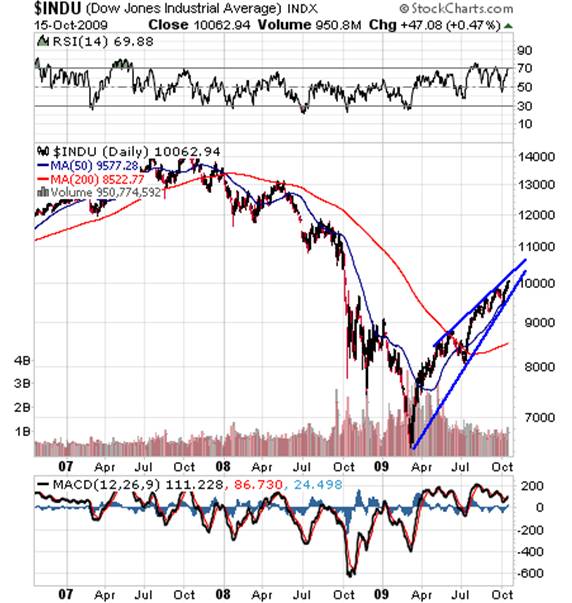
The reader might now look at the chart of the Dow Industrials on its own. It is also approaching the apex of a wedge – and also it should also be noted how the RSI is reaching for overbought territory and the MACD MA’s are showing falling tops. Here, a resolution may be anything up to four weeks away
Some theory relating to wedges:
Two quotes from Edwards and Magee, Technical Analysis of Stock Trends, 5th edition at page 156:
“In a Rising Wedge … there is no evident barrier of supply to be vaulted but rather a gradual petering of investment interest”
“Thus, a Rising Wedge typifies a situation which is growing progressively weaker in the technical sense.”
[Analyst observation: Note how volume on the above chart has been declining since April 2009. The “spike” in the past couple of days has been counter to the trend and may have arisen from book balancing behavior. Volume should be watched carefully over the coming few days. Breakouts, one way or another, typically occur on rising volume.]
The chart below, of US Steel in 1937, is reproduced from Edwards and Magee at page 155
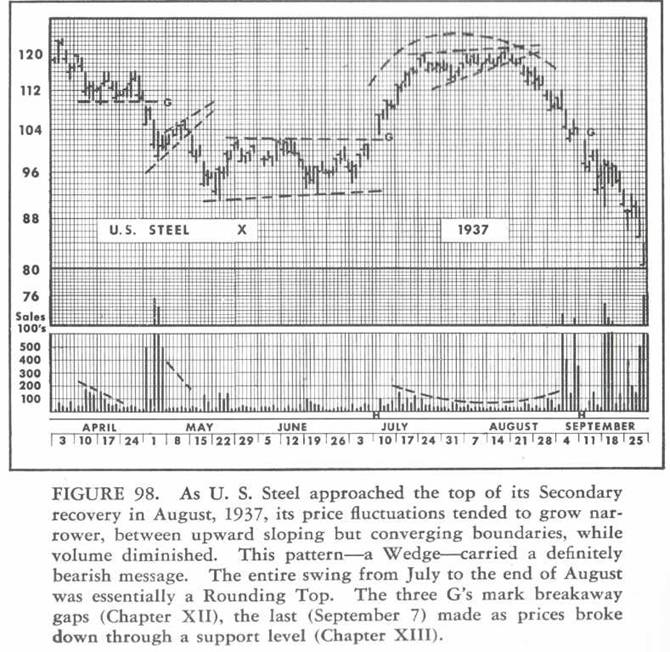
The reader’s attention is drawn to the words “approached the top of its Secondary recovery”. A rising wedge is typically a reaction against the prevailing trend and, when the rising wedge is penetrated on the downside, the prevailing trend re-emerges.
Of some significance, this analyst has, on two or three occasions in the past few years, seen an exception to this general statement in that, sometimes, if the rising wedge is in line with the prevailing trend and the volume is robust, the wedge may turn out to be a continuation pattern. This “may” turn out to be the case with gold, because the direction of the Primary trend is “up” and the wedge is not running counter to that trend. It “may” also turn out to be the case with the US Dollar, because the Primary trend of the dollar is “down” and the wedge is not running counter to that trend.
However, in the case of Industrial Equities, the author hereof has been opining unequivocally for several weeks that, in his view, the Primary Trend is “down”.
In the interests of both integrity and objectivity it is pointed out that the rising wedge in the chart above (US Steel) took about two months to complete. Depending on how one interprets the lines, the wedge in the current Dow chart took a minimum of three months to complete. The wedges in the gold price chart and the dollar chart have taken at minimum seven months to manifest and there have been no rounding tops. This presents yet further evidence that they “may” not be genuine reversal patterns. However, volume in the industrial equities market has been behaving consistently with expectations associated with a wedge. This particular wedge looks genuine.
This technical assessment is “confirmed” by the underlying fundamentals for the following reasons:
1. The degree of jawboning by our political, financial and economic leaders in the past few months has been extraordinary and this has given rise to extraordinary confusion in the market place. Literally trillions of dollars have been thrown around like confetti without any thought as to who is going carry the burden of these additional dollars. The message of all this jawboning has basically been “Trust us. We know what we are doing”. This analyst’s response is: “Oh yeah? If you know what you are doing then how did we get into this mess in the first place? The bottom line is that this mess has been caused by an unbridled reliance on debt at all levels of society and now you want to address the consequences by ramping up the debt at a faster pace? There’s an old line from the Goon Show that used to air on radio around 40 years ago which seems to be appropriate about now. If memory serves, it was Bluebottle who said: ‘I may be stupid, but I’m not a fool’. The evidence suggests that you haven’t got the faintest idea whether what you are doing will work or not.”
2. The underlying fundamentals, whilst clearly improving, may merely be evidencing a bounce from lows. One needs to remember that the increase in economic activity has been the direct result of the stimulus – which stimulus is now working its way through the system. The first home buyers rebate and the cash for clunkers deals are about to become history – unless, of course, the authorities who claim to know what they are doing decide on the spur of the moment to extend these rebates by printing yet more paper dollars. That would be a brilliant example of knee-jerk planning.
3. Notwithstanding all the “green shoot” hype in the market place leading up to the reporting season for the most recently passed quarter; so far, the numbers are nothing to write home about. For example, Citigroup made a predicted (by some analysts) loss for the quarter of up to 38 cents a share. You remember Citi? Citi was the bank that had to be bailed out by the US Government to the tune of $45 billion and whose CEO said on September 16th 2009 (a couple of weeks ago) that “you could easily see [this $20 billion of preferred securities] being paid off” (http://www.marketwatch.com/story/citi-could-repay-20b-government-investment-ceo-2009-09-16 ) Oh? Really? With your provision for bad debts now at $8.9 billion? Why would you consciously move to reduce your preferred equity capital under those circumstances?
4. The run-up should be seen in context of the Twelve Month Trailing (TMT), GAAP adjusted Earnings Per Share. In the table below (source: DecisionPoint.com)
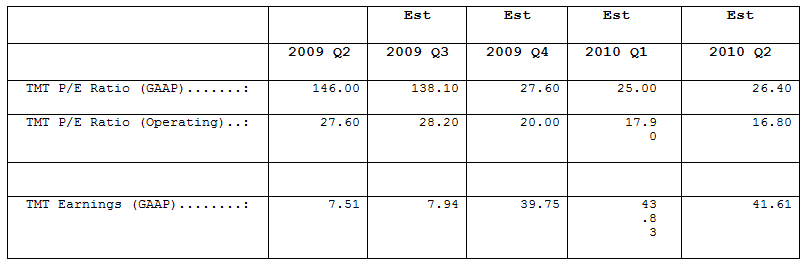
Now let’s understand what these numbers are telling us.
The markets are expecting TMT to Q3 2009 to be $7.94 and then “suddenly” to jump to $39.75 in Q4 of 2009 and then RISE by around 10% to $43,83 in Q1 2010 and the FALL again by 5% to $41.61 in Q2 2010.
As at last night (October 15th 2009), the SPX closed at 1096.56. This implies a FORWARD looking P/E ratio of 1096.56/41.61 = 26.35X
Peering into the murky future and against a background where the last quarter’s earnings are (so far) ho-hum, the P/E ratio based on FORECAST earnings adjusted for Generally Accepted Accounting Principles is 26.35X.
Historically, most Bull Markets have ended when multiples were around or below this level in an atmosphere of froth and bubble. Now, based on a V shaped recovery from the worst recession since WWII, the market is factoring in “hysterical” (as opposed to historical) P/Es?. By way of context, a typical Bear Market ends with P/Es of around 8 – 10X and the “average” P/E is around 15X.
Conclusion
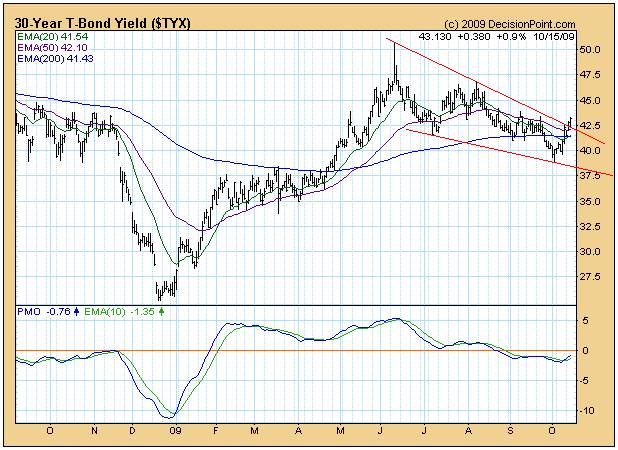
Let me stick my neck out here. Monetary inflation cannot reasonably give rise to increasing profitability (which is the only reason why hysterical P/E ratios might be justified) in an environment where unemployment is growing. From both a technical perspective and a fundamental perspective, the wedge on the industrial equities index chart is probably real. Further, caution seems appropriate with regard to the dollar. It might be dangerous to short the dollar at this point because, technically, it “might” break up and there may be a sound fundamental reason for this: Conceivably the dollar “might” rise if US interest rates start to spike. (See chart below, courtesy DecisionPoint.com). If interest rates spike and this causes a scramble of dollar short covering, we might see blood in the streets because the speculators could be pole-axed. A falling dollar is a mite too obvious right now.
Analyst’s Comment
In all fairness to our illustrious leaders, their behavior has been quite rational. They can hardly expect to be re-elected if they stand up in public and tell us that things are bad. It’s there job to foster a spirit of optimism. For example, it’s Obama’s job to stand up and say that his administration is going to keep going until "every single American in this country who's looking for work is going to be able to get the kind of well-paying job that supports their families." (Source: http://apnews.myway.com/article/20091014/D9BB4MD80.html ). But I ask you as a reasonable person. “Doesn’t the very ridiculousness of this statement engender some doubt in your mind?”
The question boils down to why anyone in his right mind would expect that – assuming we keep everything else equal – aiming a fire hose of money at an already drowning economy is going to make it any easier to breathe.
At the end of the day, the driver of economic activity is entrepreneurial endeavor which is applied to address market opportunities flowing from new technological developments – all of which is “greased” by the application of capital. When the economic motor is running strongly and the economy has developed a momentum, then the service sector can reasonable grow on the back of a vibrant economy. But the service sector has to have something to service. To argue that the service sector “is” the economy shows a lack of understanding of the dynamics of wealth creation across the system. It might work for the individual, but not across the system as a whole.
Contrary to the hopes and wishes Capital is not an engine of growth. It is the grease on the economic wheel. And the longer it takes our leaders to face up to this reality, the worse the “recession” is going to be.
In my recently published novel, Beyond Neanderthal, a 100,000 foot view is taken of what gave rise to the current debacle and what, in principle, we might do about it. What is needed in the current environment is “outside the box” thinking. Beyond Neanderthal – copies of which can be ordered via www.beyondneanderthal.com or via Amazon – is chock full of outside the box thinking. But there are no silver bullets. It’s going to take time.
Brian Bloom
Beyond Neanderthal is a novel with a light hearted and entertaining fictional storyline; and with carefully researched, fact based themes. In Chapter 1 (written over a year ago) the current financial turmoil is anticipated. The rest of the 430 page novel focuses on the probable causes of this turmoil and what we might do to dig ourselves out of the quagmire we now find ourselves in. The core issue is “energy”, and the story leads the reader step-by-step on one possible path which might point a way forward. Gold plays a pivotal role in our future – not as a currency, but as a commodity with unique physical characteristics that can be harnessed to humanity's benefit. Until the current market collapse, there would have been many who questioned the validity of the arguments in Beyond Neanderthal. Now the evidence is too stark to ignore. This is a book that needs to be read by large numbers of people to make a difference. It can be ordered over the internet via www.beyondneanderthal.com
Copyright © 2009 Brian Bloom - All Rights Reserved
Disclaimer: The above is a matter of opinion provided for general information purposes only and is not intended as investment advice. Information and analysis above are derived from sources and utilising methods believed to be reliable, but we cannot accept responsibility for any losses you may incur as a result of this analysis. Individuals should consult with their personal financial advisors.
Brian Bloom Archive |
© 2005-2022 http://www.MarketOracle.co.uk - The Market Oracle is a FREE Daily Financial Markets Analysis & Forecasting online publication.