Stock Market Bull Trap Heading for a 50% Crash to 5,000
Stock-Markets / Financial Crash Oct 13, 2009 - 11:00 AM GMTBy: Captain_Hook
 At the risk of getting ahead of myself prior to being able to confirm the turn, I am suggesting stock market action over the past week bears the distinct odor of a bull trap, with even informed technicians still waiting for a push to 50% retracements on the indexes. In this respect then, you should realize the context of such a bull trap would be profound in that we are talking about the March lows being tested and violated, meaning for example the S&P 500 (SPX) could be on its way down to test its namesake at 500 before this next sequence is all over. You will remember from previous discussions, and in framing context correctly here, it’s possible we could be looking at a Supercycle Degree Affair lower in global stock markets directly ahead, implying 500 on the SPX would be an optimistic target for a low.
It will be important to watch what happens after quarter-end Wednesday, because if the funds cannot jam stocks higher for a window dressing related payday, we will have a good indication that at least the intermediate term direction has turned for stocks, where we will be looking to confirm this with the penetration of key supports in stock indices that will be discussed below. Further to this, and to continue framing what the future could hold correctly, I bring to your attention the latest undertakings from two market observers that appear timely in this regard, both sticking to their guns as deflationists moving forward from here. The first is from Doug Noland discussing Jim Grant’s recent defection from the bear / deflationist camp. And the second is from Mish, who amongst other things also touches on Jim Grant’s change of heart, characterizing it as a contrary indicator.
If you know me, it should come as no surprise I could not agree more in this regard. What’s more, and as discussed at length previously in the full body of my work, although I am not a deflationist, or any variety of permanent ‘flationist’ for that matter, based on the evidence before us today I do think the ‘deflationists’ finally have it right. Moreover, and to continue drawing on the compelling case in this regard, one should take a few minutes to view this video by Steve Keen, the link for which I am also borrowing from Mish, who appears to have is ducks in the appropriate row as well. Here, Steve correctly points out that collectively the global population is past ‘peak debt’, and that although private debt and credit creation do not play into some people’s definitions of money supply, anyway one wishes to count it, when we are contracting in this regard so will the economy at large, government stimulus or not.
Hold the presses. Apparently we have a landslide victory for Angela Merkel in the German national election, providing her with an opportunity to create a right of center coalition. This will undoubtedly be viewed as a very good excuse to rally the markets, so who knows, we may yet get that squeeze into month’s end after all. Be that as it may, it will of course not matter in the larger scheme of things, as neither does the German economy have a meaningful impact globally, nor will it negate the trend towards deleveraging in the larger economy. And that’s all that matters at the margin, which is the primary point in Steve Keen’s presentation, attached above. In the meantime it does in fact appear will get a window dressing related jam job into month’s end however, providing traders / investors with yet another opportunity to get short / lighten up on equities, which is a sentiment we recommend you take very seriously at this time.
Of course the bulls could give you a plethora of wrongheaded arguments on why such thinking is crazy, as crazy as the gibberish you hear on CNBC day in and day out as they continually promote the gaming of stocks higher at the behest of their corporate sponsors. Here, the better arguments would point to the inventories that need replacing, and the ‘new normal’ when it comes to perceiving largely worsening news. Less bad, history doesn’t matter this time around – you name it, these bozos are never lacking for words – only conscience and common sense. Thankfully, this is the sentiment that’s required to put an end to the games however, with the degree of the short squeeze this time around commensurate with the tops in stocks witnessed in 2000, and 2007. So again, be very careful moving forward from here because not many are, not even some veterans who should know better.
In this regard I find it surprising just how few market commentators and investors have it right in terms of the big picture considering just how critical the situation is, which is why I think an important top in stocks is in the making here. What’s worse is those who do know, and have attempted to protect themselves by hedging or speculating on the short side, have had their heads handed to them and will likely not be back during what is traditionally a period of seasonal strength directly ahead, spelling potential trouble for equities. As you should know from reading these pages previously, that’s the mechanism that keeps our faulty and fraudulent markets moving in directions the consensus is not expecting. This is the mechanism, when combined with generous liquidity, that keeps stocks going up when they should be going down until both the bulls and bears become exhausted, allowing for the whole shooting match to collapse at this point.
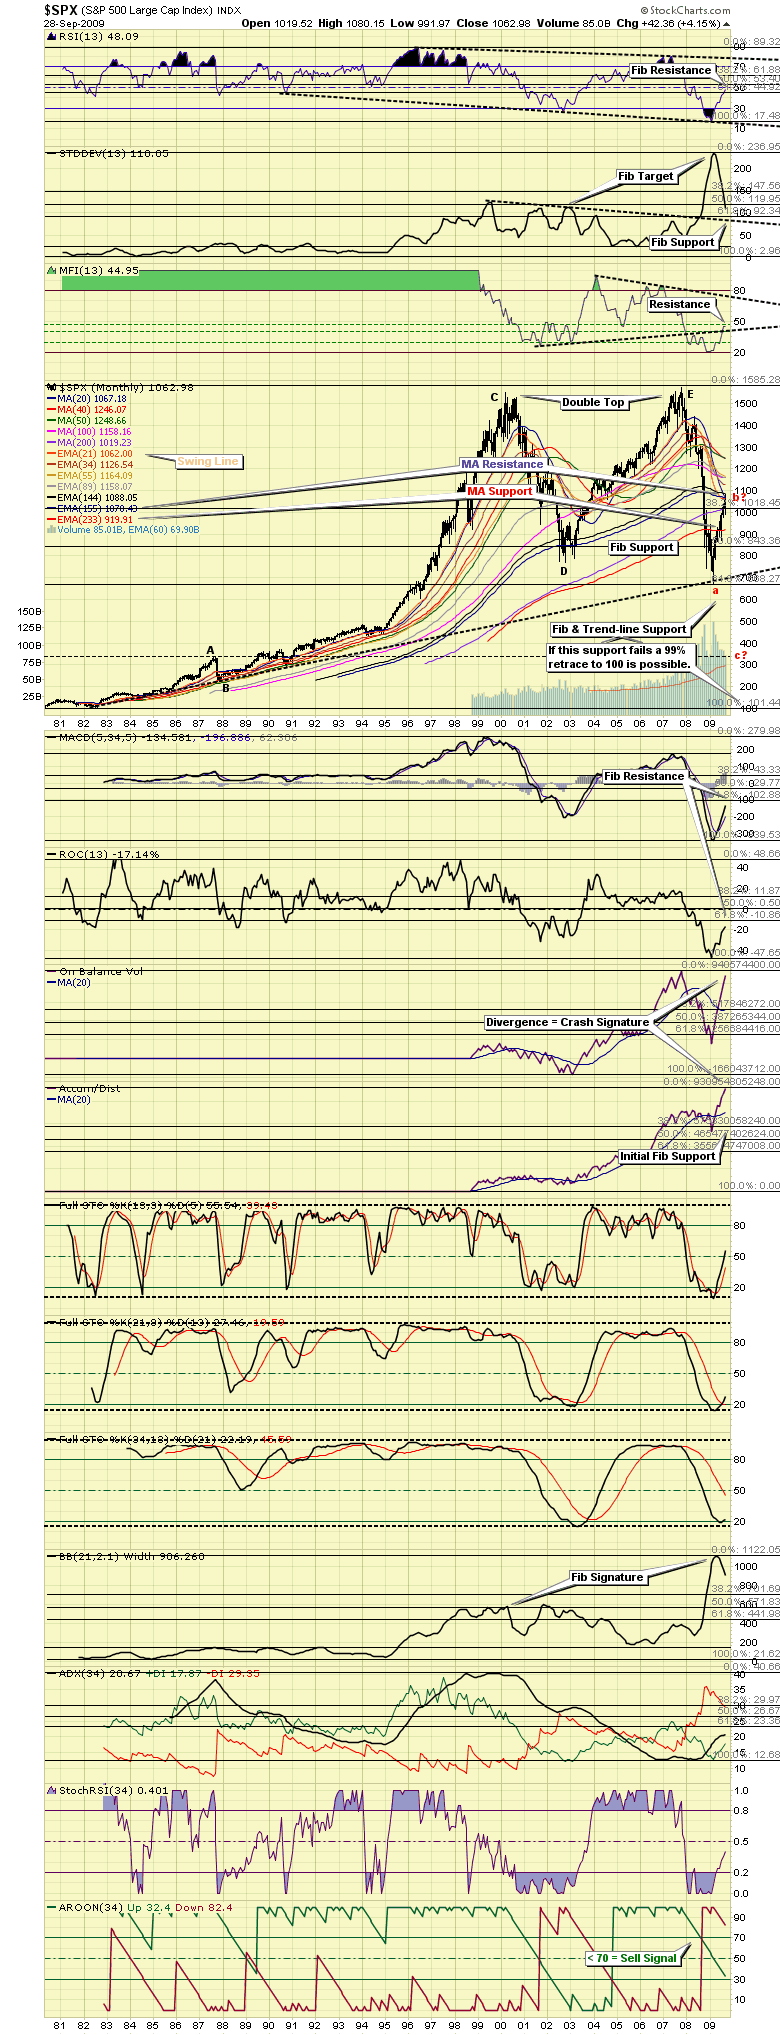
And that’s where we are in my opinion, very closed to the point where both the bulls and bears become exhausted, marked by what is the annual period of seasonal strength in stocks, which should see a cessation of shorting / put buying, thus enabling our faulty and fraudulent (and seriously overbought) markets to fall. Or in other words, the bears will finally be exhausted, joining the bulls in the financially strapped department after getting creamed since March. That’s what a good mania does – first it financially destroys the bulls, and then the bears within the wild reactions to the eventual crashes. In terms of important technical points in the indices to watch for, let’s take a look at the same charts that we used a few weeks back because they tell us everything we need to know in terms of measuring / identifying the end to this reaction higher since March. (See Figure 1)
Figure 1
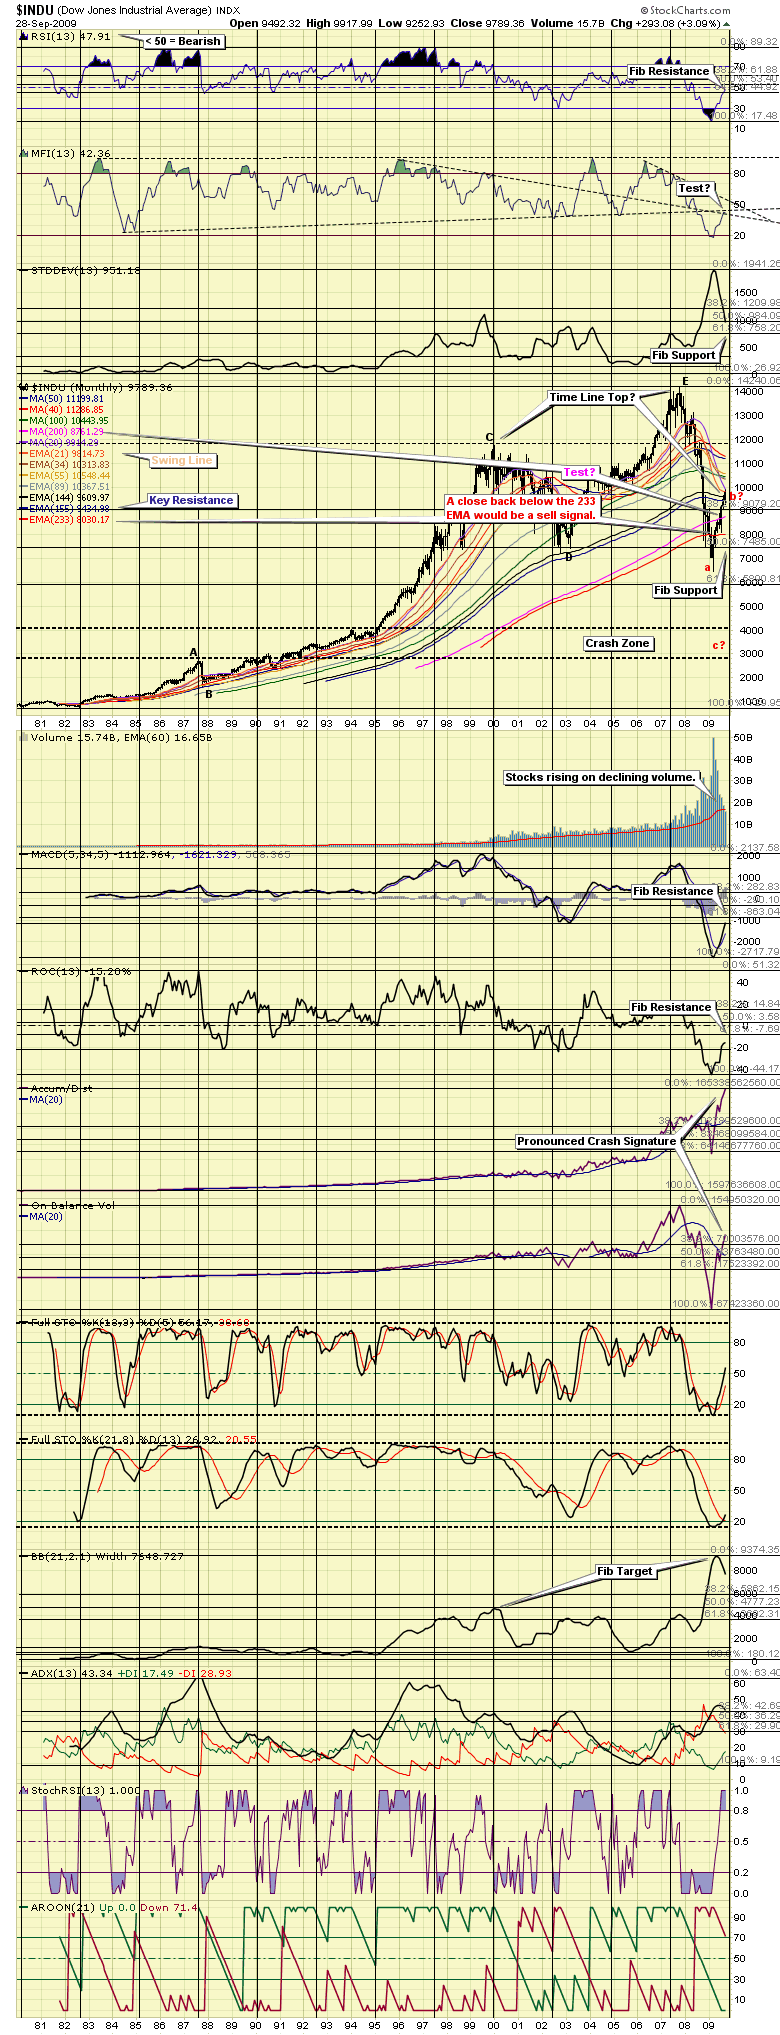
As you can see above (and below) we are talking about the monthly charts of the SPX, Dow, and NASDAQ / Dow Ratio, which while not effective tools in monitoring all the noodling around stocks could do before setting the present bull trap, are irreplaceable in identifying likely tops, turns, and acceleration points in the larger moves. In terms of the SPX then, what we see above is that prices have reached significant moving average (155-EMA) and Fibonacci resonance related resistance, where although volleys slightly above these measures could occur (the 50% retrace could take prices to 1120), for all intents and purposes the reaction higher should be turned back lower from here, and accelerate once the Fibonacci 233-month exponential moving average (EMA) is re-crossed to the downside. And of course the same technicals hold for the Dow as well (seen below), only as you can see I have included the observation the 200-month simple moving average (MA) (in pink) could provide temporary support that may appear to be a test to some on the way back down. (See Figure 2)
Figure 2
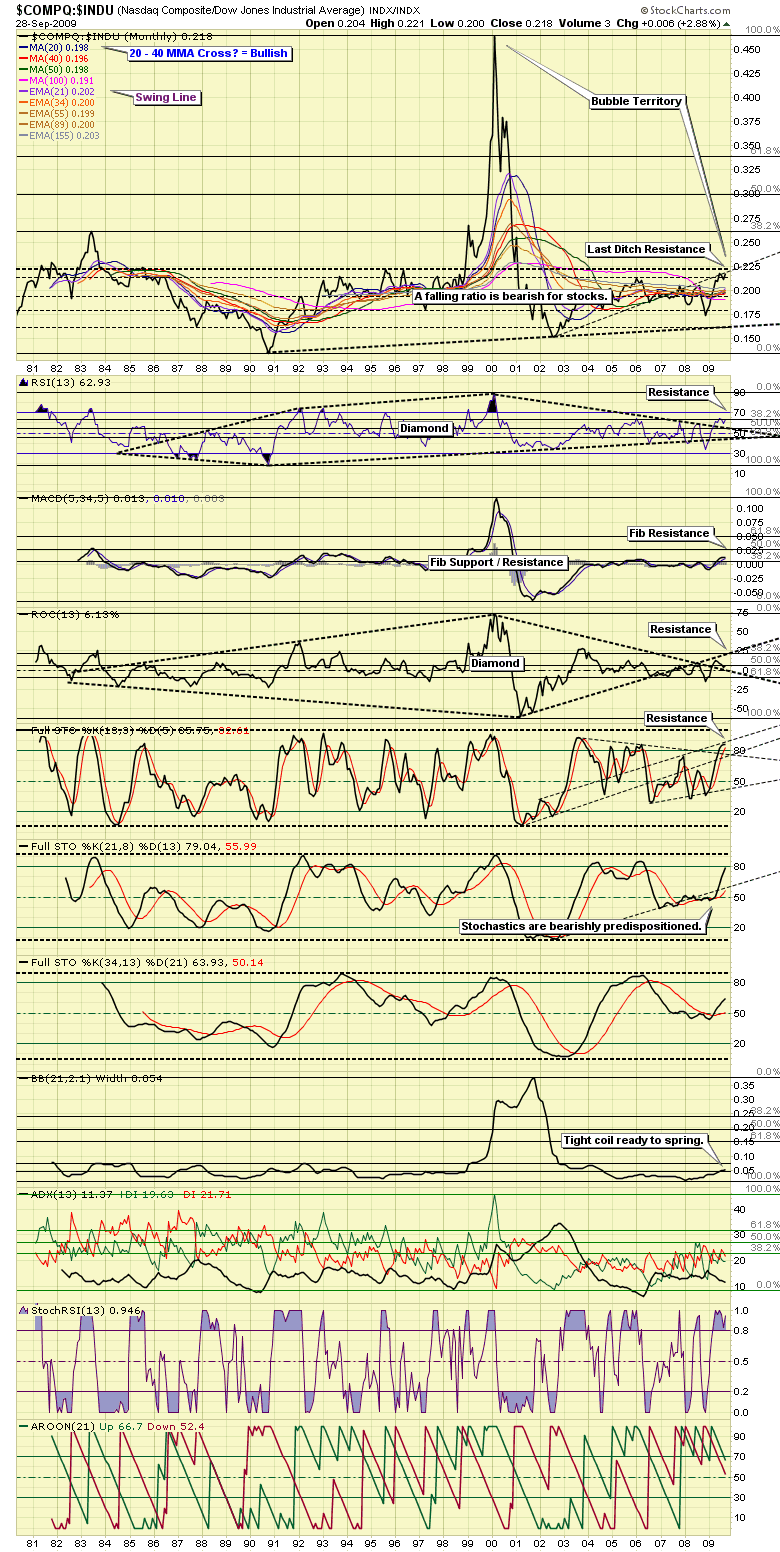
How can I be so sure stocks are in fact destined to head substantially lower? While the possibility of a more extreme bubble cannot be discounted, which would be measured by the NASDAQ / Dow Ratio exceeding what I have labeled ‘last ditch resistance' in Figure 3 below, once any such strength is spent, as you can see in all prior instances since 1980, substantially lower values should be anticipated once the bubble is popped. So, while the present ‘government finance bubble’ (borrowing this appropriate terminology from Doug Noland) could have further to go as measured in outperformance by volatile / speculative technology companies, as you can see below, once such a sequence is complete, a trip to the lower end of the larger range should be anticipated, likely bringing the NASDAQ to lower lows when compared to last year, at a minimum. (See Figure 3)
Figure 3
And in returning to Figure 2 to put a more enhanced technical perspective on the ‘big picture’ in this regard, not only do we have what could prove to be a potentially bearish time line turn approaching for the Dow if history is a good guide, but more, we also know such a turn would be important from the perspective the ‘crash signature’ in the trade is even more pronounced that it was at the top in 2007. This implication here is that stocks should react lower off whatever highs are seen in coming days with at least a halving then, which in terms of the Dow would put us down into the 5,000 area.(i.e. and 500 on the SPX.) Of course if the larger sequence is a Supercycle Degree Affair, well, then prices could go mush lower, as indicated by the ‘crash zone’ included on Figure 2 for your information. And this larger sequence could start tomorrow with one more window dressing related jam job higher for stocks into quarter-end.
Further to this, and something that is telling in this regard, is we did not get confirmation of the move’s sustainability in the currency or precious metals markets yesterday, where gold and precious metals shares did not rally with stocks, and the dollar ($) did not sell off either. What this means is precious metals / currency traders do not expect strength in stocks to last, which jives with our views that once the quarter-end jam job is passed, the vacuum under the market could become apparent. Here, its important to realize only crazed hedge / mutual / pension funds are buying into Wednesday to pad their earnings, and they are using other people’s money to do this. If it were there own money such lunacy would never occur of course, not with fundamentals being what they are. Not all of these fund managers are idiots you should know.
Good investing is very possible in gold, out of the control of such people.
Good investing all.
By Captain Hook
http://www.treasurechestsinfo.com/
Treasure Chests is a market timing service specializing in value-based position trading in the precious metals and equity markets with an orientation geared to identifying intermediate-term swing trading opportunities. Specific opportunities are identified utilizing a combination of fundamental, technical, and inter-market analysis. This style of investing has proven very successful for wealthy and sophisticated investors, as it reduces risk and enhances returns when the methodology is applied effectively. Those interested in discovering more about how the strategies described above can enhance your wealth should visit our web site at Treasure Chests
Disclaimer: The above is a matter of opinion and is not intended as investment advice. Information and analysis above are derived from sources and utilizing methods believed reliable, but we cannot accept responsibility for any trading losses you may incur as a result of this analysis. Comments within the text should not be construed as specific recommendations to buy or sell securities. Individuals should consult with their broker and personal financial advisors before engaging in any trading activities, as we are not registered brokers or advisors. Certain statements included herein may constitute "forward-looking statements" with the meaning of certain securities legislative measures. Such forward-looking statements involve known and unknown risks, uncertainties and other factors that may cause the actual results, performance or achievements of the above mentioned companies, and / or industry results, to be materially different from any future results, performance or achievements expressed or implied by such forward-looking statements. Do your own due diligence.
Copyright © 2009 treasurechests.info Inc. All rights reserved.
Unless otherwise indicated, all materials on these pages are copyrighted by treasurechests.info Inc. No part of these pages, either text or image may be used for any purpose other than personal use. Therefore, reproduction, modification, storage in a retrieval system or retransmission, in any form or by any means, electronic, mechanical or otherwise, for reasons other than personal use, is strictly prohibited without prior written permission.
Captain Hook Archive |
© 2005-2022 http://www.MarketOracle.co.uk - The Market Oracle is a FREE Daily Financial Markets Analysis & Forecasting online publication.


