Bank of England MPC UK Inflation Forecasting Track Record Analysis
Interest-Rates / UK Interest Rates Oct 12, 2009 - 04:34 AM GMTBy: Lloyds_TSB
 Each year, in the August Inflation Report, the Bank of England reviews the accuracy of the inflation forecasts made by the UK Monetary Policy Committee (MPC). The reports have become of increased interest, as there has been a suspicion that the policy committee has been unduly conservative about the inflation risks facing the UK economy. If true, this would suggest that over the past decade monetary policy may have been tighter than it should have been given the MPC’s strict inflation remit. By extension, GDP growth may have been commensurately, but unnecessarily, weaker. However, some also argue that the MPC has underestimated inflation. If so, there is a risk that policy has been too loose, potentially leading to higher inflation.

Measures of the MPC’s forecast accuracy
To measure the accuracy, or otherwise, of the MPC’s inflation forecasts, a number of variables need to be taken into account. Most obviously is a measure of the average error of the forecast itself. But what also matters is the degree of dispersion of the MPC’s forecasting errors and whether the skew and distribution of the MPC’s forecasts – the so-called fan charts – have been an accurate representation of the risks and uncertainties surrounding the inflation outlook.
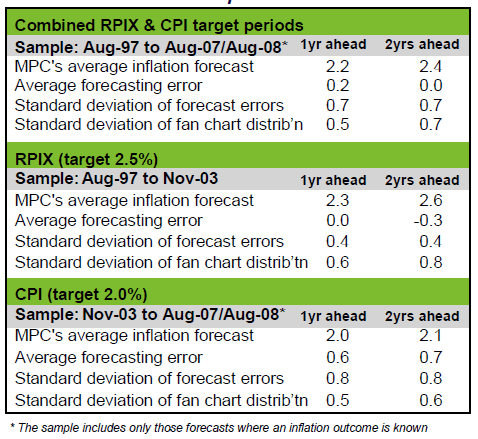
So how has the committee performed? The answer seems to be not badly. Since the MPC was established, its average forecasting error for inflation in two years’ time has, remarkably, been zero. Interestingly, its record for forecasting inflation two years ahead has, on average, been better than its record for forecasting inflation one year ahead, where the forecast error has averaged 0.2% since 1997.
There have been signs of systematic bias in its forecasts
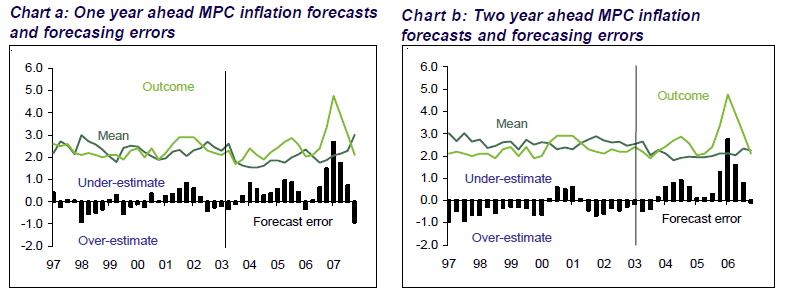
Yet, on closer examination the average over the past twelve years disguises periods when the MPC has both systematically over and under-estimated inflation. Charts a and b show the MPC’s inflation forecasting errors in more detail. The charts show that the committee over-predicted annual RPIX inflation for much, if not all, of the period from August 1997 to February 2001. This was a time of significant structural change: globalisation and the broader use of technology were fostering greater competition, the rise in competition and sterling were bearing down on import prices, and high street retailers were engaged in intense price wars. It seems the MPC may have under-estimated the importance of the structural forces bearing down on inflation during this time.

 However, between 2004 and August 2007 (the latest date for which the accuracy of the MPC’s two-year inflation forecast can be measured), the MPC has generally under-predicted inflation. This was particularly the case in Q3 2008, when CPI inflation averaged 4.8%, more than twice the rate the MPC forecast both one and two years earlier. The under-prediction of inflation appears to have been due, in large part, to the surprise rise in food and energy prices and the sharp fall in sterling around this time. It is these trends that now worry some observers. If sustained they could lead to a sharp rise in inflation.
Yet the analysis shows that the MPC’s inflation forecasts exhibit no systematic bias. Although there may have been periods when the MPC has exhibited some systematic error in its forecasting, over the period as a whole it has performed exceptionally well. It is difficult to conclude that monetary policy has been systematically too tight, or indeed, too loose, based on the forecast errors observed since 1997. This does not address, however, the question of whether the committee has been consistently too conservative in its assessment of the risks surrounding the inflation outlook.
The MPC may have been overly cautious, but with good reason
In this regard, there is some evidence to suggest that the committee has had a predisposition to expect higher rather than lower inflation outcomes. Since 1997, 40% of the MPC’s two-year inflation fan charts have had an upward skew, compared with 27% that have had a downward skew. If this was justified, one would expect that the frequency of inflation outcomes would be uniformly spread over the entire distribution. Since 1997, however, there have been far fewer ‘high inflation’ outcomes that the MPC’s fan charts would suggest. Indeed, 68% of the inflation outcomes have fallen within the inter-quartile range - the middle 50% of the MPC’s two-year inflation fan chart. This suggests, not only have the MPC’s two-year inflation forecasts been unduly skewed to the upside, but that, on average, they have also been unduly dispersed.
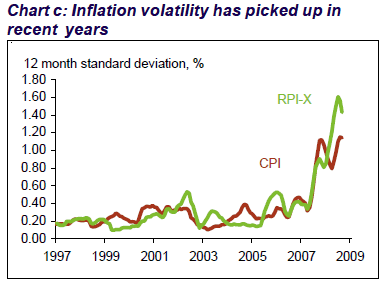
Nonetheless, there may have been good reasons for this. Arguably the MPC was strongly justified in adopting a cautious approach to forecasting inflation. This was, perhaps, particularly the case in the early years of its formation, when it was seeking to establish its credibility and when the volatile inflation experience of the 1980s and early 1990s was still relatively fresh in policy-makers minds. Over recent years, the degree of dispersion in the MPC’s fan charts appears justified by the more volatile inflation environment that has emerged since 2007, see chart c. As table 1 shows, the standard deviation of the two year CPI fan chart since November 2003 has been less than the average dispersion of the committee’s forecast errors over this period. In short, this suggests the MPC has been right to attach a higher probability to extreme outcomes, particularly in recent years.
Overall, the Monetary Policy Committee’s forecasting record has been a good one
The MPC’s performance should be measured not just by how close it has managed to achieve the inflation target, but whether there have been any systematic, or avoidable, errors in its inflation forecasts. While there have been periods when its forecasts have exhibited some bias, the sample periods may not be long enough to draw any firm conclusions. Taking the period as a whole, there appears little evidence to suggest that the MPC has been either too relaxed or too constrained with regards to monetary policy.
Adam Chester, Senior UK Macroeconomist, Corporate Markets
For more information: Emile Abu-Shakra Manager, Media Relations Lloyds TSB Group Media Relations Tel 020 7356 1878 http://www.lloydstsbcorporatemarkets.com/
Lloyds TSB Archive |
© 2005-2022 http://www.MarketOracle.co.uk - The Market Oracle is a FREE Daily Financial Markets Analysis & Forecasting online publication.


