Gold and Silver Stocks Sentiment Analysis
Commodities / Gold & Silver Stocks Oct 06, 2009 - 08:51 AM GMTBy: Jordan_Roy_Byrne
 In analyzing the sentiment towards gold stocks, I am going to start with a tactic from Bernie Schaeffer of Schaeffer’s Research. I believe he espouses the idea of looking at the consensus view of analysts. If most analysts are bullish on a stock or sector, then where is the money going to come from to push shares higher? Conversely, if a sector is rising but the analysts are not bullish, they can change their mind and that provides further buying power.
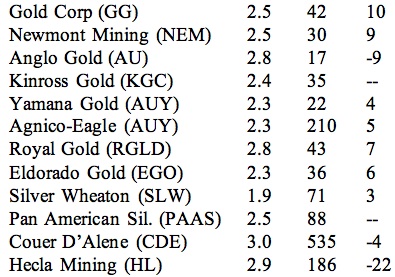
As far as the gold and silver shares, I was curious as to the consensus analyst rating, 2010 earnings growth forecast and price target. In the graph below, I show the current analyst rating on the stock, the consensus forecast for 2010 earnings growth and how far above the current price, the mean price target is. Remember that analysts rate stocks 1.0 (strong buy) to 5.0 (strong sell). A 3.0 means hold, while a 2.0 means buy or accumulate. Since Wall Street is naturally optimistic, a 3.0 basically means “sell” and a 2.0 means “hold”.

Only Silver Wheaton has a rating below a 2.0. Most gold and silver shares are rate from a 2.3 to 2.8. The next two columns are very interesting. The second column is the consensus 2010 earnings growth forecast and the third column is how far above the price target, the stock currently is. Analysts are expecting very good earnings growth in 2010, yet they don’t expect the stocks to move very much? In recent days, the stocks have gained a lot. It seems that the rating and price targets don’t fit with the earnings growth.
This is a good sign if you are a bull on gold and silver shares. Analysts have yet to jump on board and that means that clients at those firms are not invested or at least underinvested in gold and silver shares. Moving along lets take a look at some options data.
Options Data
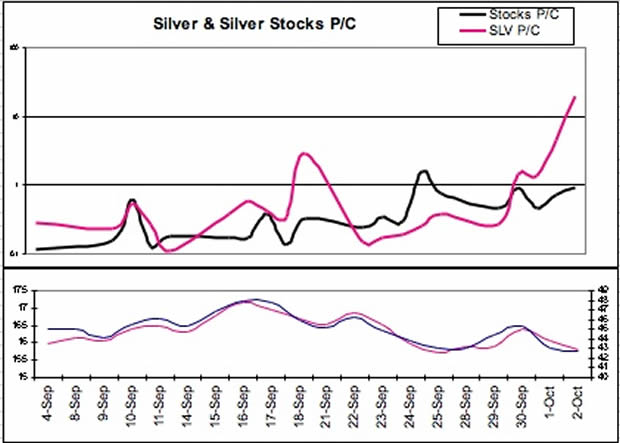
The first chart shows the ISE Put/Call ratio for SLV and the cumulative Put/Call ratio (ISE) for all the Silver stocks we track. The bottom graph shows the price of SLV and price of GDX. We can see that GDX and SLV are basically flat throughout the period, yet the Put/Call ratios in both SLV and the silver shares are rising steadily. Often times, a spike in the put/call is a strong signal of a potential bottom.

In this chart we show the ISE Put/Call for GDX and a cumulative ISE Put/Call ratio for all of the gold stocks we track. The blue is the CBOE Open Interest Put/Call ratio. The signals are not quite as strong as for Silver but the ISE figures were steadily rising from September 11 to September 25.
Short Interest Data
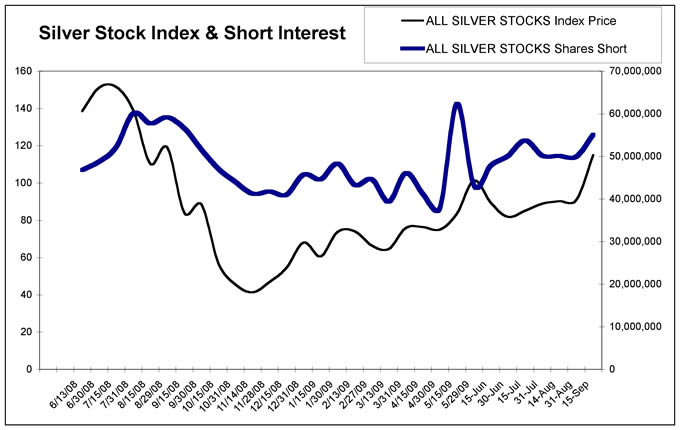
In our Gold & Silver stock newsletter, we collect short interest data and use it to build these simple charts. The first chart is the cumulative short interest for all the silver stocks we track. We graph the changes in short interest with a silver index we made. It is considered bullish when short interest rises along with the particular market. Since the end of April, short interest in silver stocks has risen steadily.

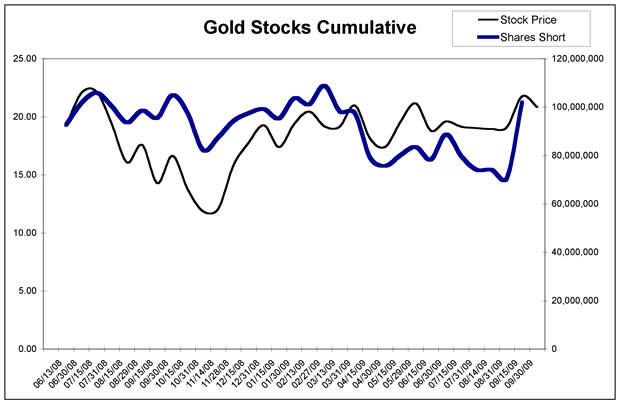
Here we show the short interest for all of the gold stocks we track. Our price index is XGD, the Canadian Gold Stock ETF. The short interest surged 44% in the period of September 1 to September 15. New short interest figures are available Friday on NASDAQ’s website.

Conclusion
Some sentiment data can give strong signals while some sentiment data has to be interpreted in a different way. I actually think that some analysts place too high of importance on sentiment data. Remember that the crowd is actually right most of the time. It is best to use sentiment data to predict turning points and for market timing purposes. I prefer to use sentiment data in conjunction with technical analysis.
In looking at the various data provided here, one has to feel pretty good if you are a bull on gold and silver stocks. First, the analysts on the street don’t have high expectations for the shares, despite the positive outlook for metals prices and profit margins. Secondly, we see constructive put-call data following the mid September peak. In other words, options data gives no sign of excessive bullish sentiment or even bullish sentiment. Finally, the surge in short interest shows strong skepticism about the ability of the shares to sustain these prices.
A daily close above 445 on the HUI should induce quite a bit of short covering.
For more info on our gold/silver newsletter, visit: http://trendsman.com/Newsletter/GSletter.htm
By Jordan Roy-Byrne
trendsman@trendsman.com
Editor of Trendsman Newsletter
http://trendsman.com
Trendsman” is an affiliate member of the Market Technicians Association (MTA) and is enrolled in their CMT Program, which certifies professionals in the field of technical analysis. He will be taking the final exam in Spring 07. Trendsman focuses on technical analysis but analyzes fundamentals and investor psychology in tandem with the charts. He credits his success to an immense love of the markets and an insatiable thirst for knowledge and profits.
Jordan Roy-Byrne Archive |
© 2005-2022 http://www.MarketOracle.co.uk - The Market Oracle is a FREE Daily Financial Markets Analysis & Forecasting online publication.


