


Stock Market Pullback Would Be Healthy
Stock-Markets / Stock Index Trading Sep 28, 2009 - 08:07 AM GMTBy: Guy_Lerner

 A pull back should be viewed as healthy within a strongly trending market. However, the "moon shot"rally that started in July, 2009 has been characterized by nary a pullback, so the current 2.2% drop in the S&P500 must be producing a little bit of angst amongst the bulls. Relative to the past 2 months, a 2.2% drop counts as deeply oversold. But really, very little has changed. The major indices are still within ascending channels. Investor sentiment remains extremely bullish. As I have been stating for several months now, there is an upward bias until the extremes in bullish sentiment are unwound.
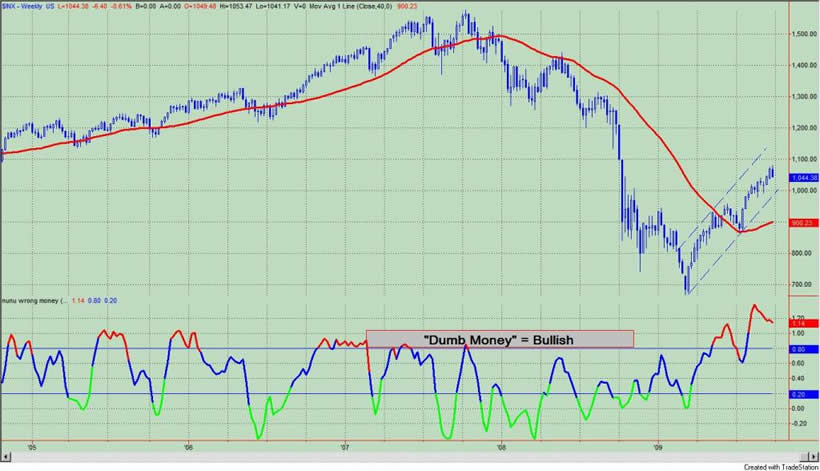
The "Dumb Money" indicator is shown in figure 1. The "Dumb Money" indicator looks for extremes in the data from 4 different groups of investors who historically have been wrong on the market: 1) Investor Intelligence; 2) Market Vane; 3) American Association of Individual Investors; and 4) the put call ratio. The "dumb money" remains extremely bullish.
Figure 1. "Dumb Money" Indicator/ weekly
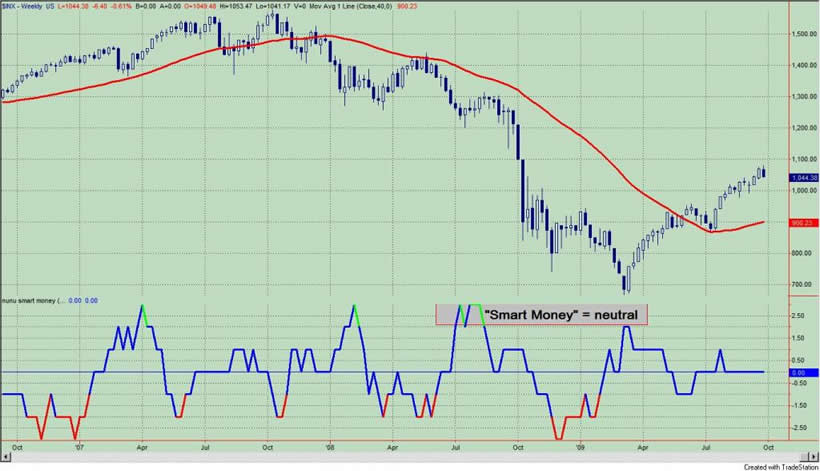
The "Smart Money" indicator is shown in figure 2. The "smart money" indicator is a composite of the following data: 1) public to specialist short ratio; 2) specialist short to total short ratio; 3) SP100 option traders. The "smart money" is neutral.
Figure 2. "Smart Money" Indicator/ weekly
Company insiders continue to sell shares to an extreme degree. See figure 3, a weekly chart of the S&P500 with the Insider Score "entire market" value in the lower panel.
Figure 3. InsiderScore Entire Market/ weekly
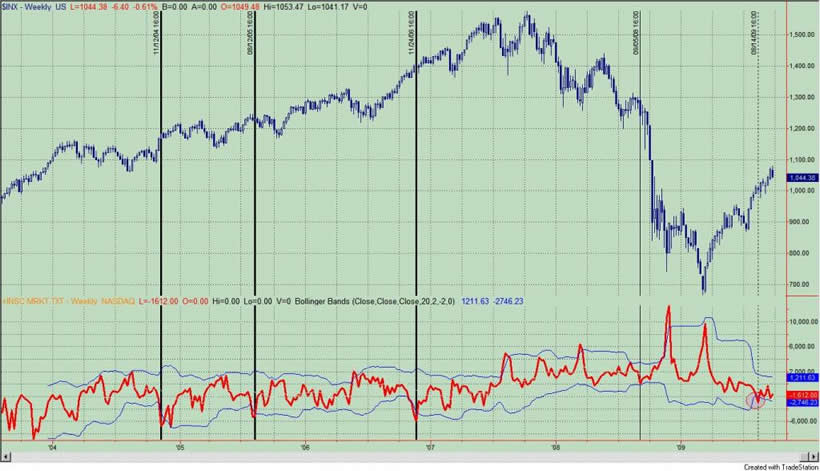
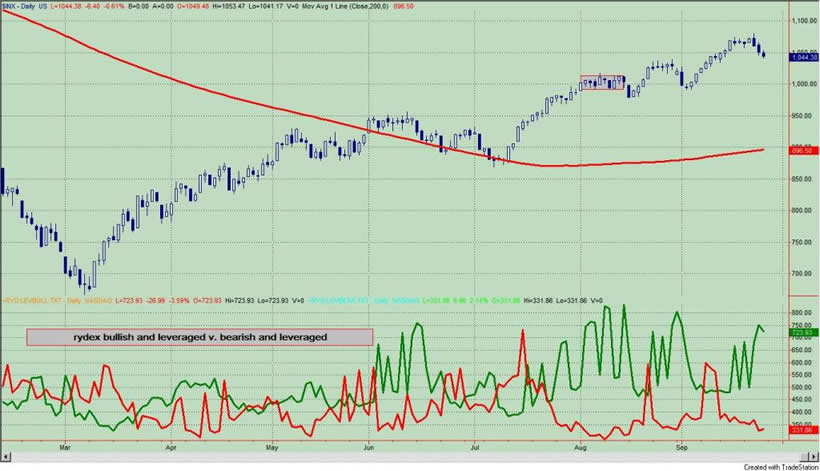
Figure 4 is a daily chart of the S&P500 with the amount of assets in the Rydex bullish and leveraged funds versus the amount of assets in the leveraged and bearish funds. Not only do we get to see what direction these market timers think the market will go, but we also get to see how much conviction (i.e., leverage) they have in their beliefs. Typically, we want to bet against the Rydex market timer even though they only represent a small sample of the overall market. As of Friday's close, the assets in the bullish and leveraged funds were greater than the bearish and leveraged by a ratio of 2 to 1; referring to figure 4, this would put the red line greater than green line.
Figure 4. Rydex Bullish and Leveraged v. Bearish and Leveraged/ daily
By Guy Lerner
http://thetechnicaltakedotcom.blogspot.com/
Guy M. Lerner, MD is the founder of ARL Advisers, LLC and managing partner of ARL Investment Partners, L.P. Dr. Lerner utilizes a research driven approach to determine those factors which lead to sustainable moves in the markets. He has developed many proprietary tools and trading models in his quest to outperform. Over the past four years, Lerner has shared his innovative approach with the readers of RealMoney.com and TheStreet.com as a featured columnist. He has been a regular guest on the Money Man Radio Show, DEX-TV, routinely published in the some of the most widely-read financial publications and has been a marquee speaker at financial seminars around the world.
© 2009 Copyright Guy Lerner - All Rights Reserved
Disclaimer: The above is a matter of opinion provided for general information purposes only and is not intended as investment advice. Information and analysis above are derived from sources and utilising methods believed to be reliable, but we cannot accept responsibility for any losses you may incur as a result of this analysis. Individuals should consult with their personal financial advisors.
Guy Lerner Archive |
© 2005-2022 http://www.MarketOracle.co.uk - The Market Oracle is a FREE Daily Financial Markets Analysis & Forecasting online publication.