


Double Dip Economic Recession?
Economics / Recession 2008 - 2010 Sep 27, 2009 - 02:08 AM GMTBy: John_Mauldin

 What We See
And What We Don't See
The Statistical Recovery
A Double-Dip Recession?
Unemployment is high and rising. But if the recession is over, won't employment start to rise? The quick answer is no. We look deeper into the Statistical Recovery and find yet more reasons to be concerned about near-term deflation.
This week we consider all things unemployment and ponder the need to create at least 15 million jobs in the next five years to return to a full-employment economy - and the implications for both the US and world economies if we don't. Economic is often about what we can clearly see, and yet it is understanding what we can't see that gives us true insight. We start with a collection of facts that we can see and then begin a thought exercise to find the implications.
What We See
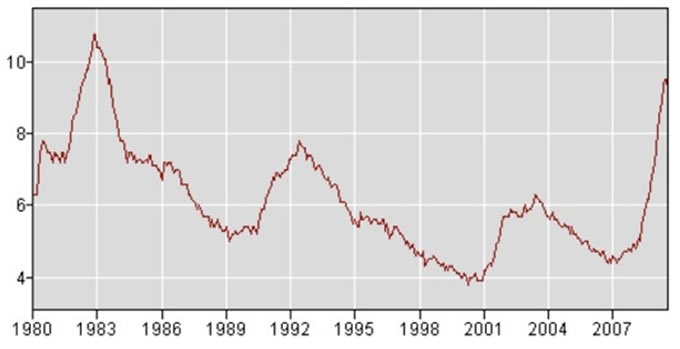
First, the unemployment rate is now officially at 9.7%. We are approaching the official high we last saw at the end of the double-dip1982 recession. In the chart below, notice that unemployment rose throughout 1980 and then began to decline, before rising rapidly as the economy entered the second recession within two years. Also notice the rapid drop in unemployment following that recession, as opposed to the recessions of 1991-92 and 2001-02, which have been characterized as jobless recoveries. Unemployment was as low as 3.8% in 2000 and saw a cycle low of 4.4% in early 2007.
(For the record, all this data is available on the Bureau of Labor Statistics website. There is a treasure trove of data. They are quite open about what they do and how they do it. When I call to ask a question, they are quite helpful. How people interpret the data is not their fault.)
This headline unemployment number (9.7%) is what we see when we read the paper. What we typically don't see is the real number of unemployed. For instance, if you have not actively looked for a job in the last four weeks, even if you would like one, you are not counted as unemployed. You are called a "marginally attached" or "discouraged" worker. Often there are very good reasons for this. You could be sick, dealing with a family emergency, going back to school, or not have transportation.
Right now, about one-third of marginally attached workers actively want jobs but have not bothered to look because they believe there are no jobs in their area, at least not for them. If you add that extra 758,000 to the unemployment data, you get what is called U-4 unemployment, which today is 10.2%. If you count all marginally attached workers the unemployment number is 11% (U-5 unemployment).
And if you add those who are employed part-time for economic reasons (i.e., they can't get full-time jobs) the unemployment number rises to 16.8%. (That is called U-6 unemployment.)
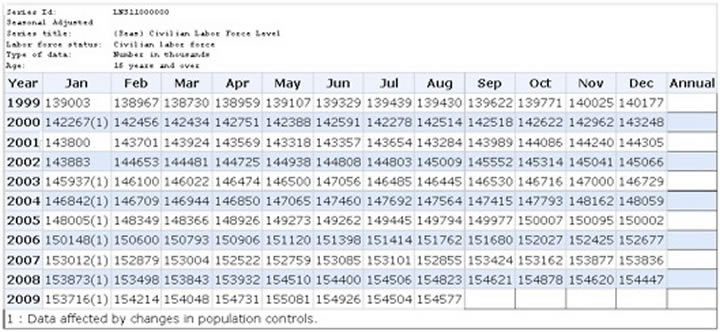
Now, stay with me for the next two tables taken directly from the BLS website. The first is the total number of people in the US civilian work force. Notice how each year the number of potential workers rises. In fact, the number of workers has risen by about 15 million over the last ten years. This is from population growth and from immigration. Also notice that the normal rise did not happen last year. That is because the number of discouraged workers has risen rapidly and, as noted above, they are not counted. We will revisit this point later. But for now, there are 154,577,000 people in the available work force.
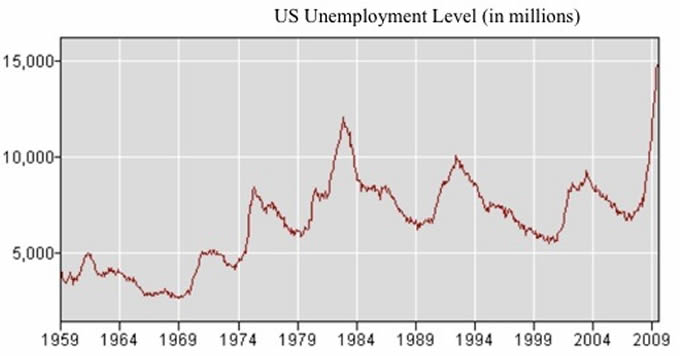
Next we look at the tables for the actual level of employment. Here we note that we are down almost 8 million jobs sincd the onset of this recession, and that there are almost 15 million people unemployed.
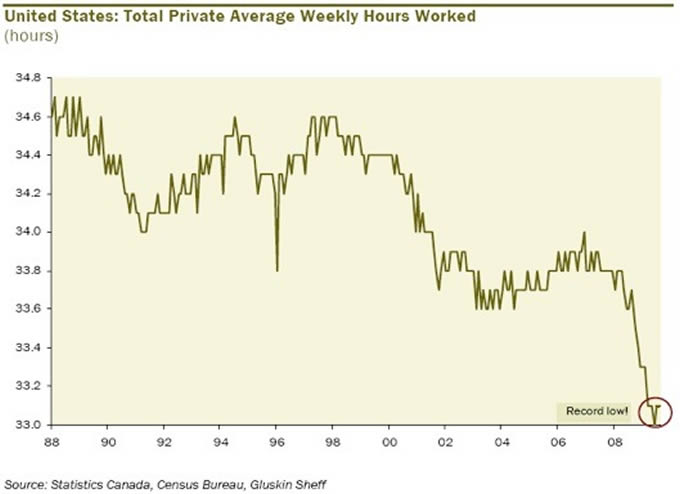
Going back to the part-time workers, there are roughly 9 million people who are working part-time because of business conditions, or those are the only jobs they could find. The average work week is at an all-time low of 33 hours. The chart below is from my friend David Rosenberg.
David wrote in a special report today:
"What does all this mean? It means that when the economy does begin to recover, when we finally get to the other side of the mountain, companies are going to raise their labour input first by lifting the workweek from its record low. Just to get back to the pre-recession level of 33.8 hours would be equivalent to hiring three million workers. And, the record number of people working part-time against their will are going to be pushed back into full-time, which will be great news for them, but not so great news for the 125,000 - 150,000 new entrants into the labour market every month. They won't have it so easy because employers are going to tap their existing under-utilized resources first since that is common sense. Also keep in mind that there are at least four million jobs in retail, financial, construction and manufacturing jobs lost this cycle that are likely not coming back. In fact, the number of unemployed who were let go for permanent reasons as opposed to temporary layoff rose by more than five million this cycle. This compares to the 1.2 million increase in the 2001 tech-led recession and in the 1990-91 housing-led recession (when Ross Perot talked about the sucking sound of jobs into Mexico)."
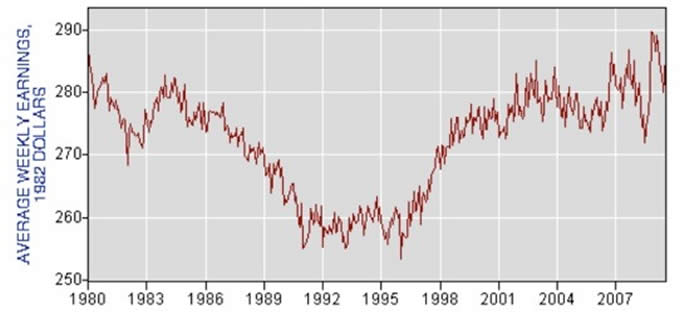
Then there is the matter of average weekly earnings. If you adjust for inflation, workers are making roughly what they did in 1980. The chart is straight from the BLS website.
And What We Don't See
Those are the facts. Now it's time to look at what we don't see, and what you don't read or hear from the mainstream media.
We saw above that we are adding about 1.5 million workers to the workplace every year. That means over the next five years we are going to need 7.5 million jobs just to maintain that growth, or about 125,000 a month. That is on the low side of what economists normally estimate, which is around 150,000 per month. If we used the 150,000 estimate, it would mean we need 9 million jobs.
There are at least 1 million (and probably more like 2 million) discouraged workers who would take jobs if the economy got better. You can derive that number by going back to early 2007 and seeing the level of discouraged workers. That means, by the end of 2014 we are going to have 163 million people in the work force (see table above).
Today we have 139.6 million jobs, and that number is likely to slip at least another half million (last month the economy lost 216,000 jobs, with a very suspicious birth-death ratio accounting for a lot of job creation). So let's call it 139 million current jobs.
Let's assume that we would like to get back to a 5% unemployment rate. That would not be stellar, but it would certainly be better than where we are today. Five percent unemployment in late 2014 will mean 8.1 million unemployed. To get to 5% unemployment we will have to create 14 million jobs in the five years from 2010-2014. (163 million in labor pool minus 8 million unemployed is 155 million jobs. We now have 139 million jobs, so the difference is roughly 15 million.) Plus the equivalent of 3 million jobs that Rosenberg estimates, just to get back to an average work week. And maybe the extra 1.5 million a year I mentioned above.
But let's ignore those latter jobs and round it off to 15 million. Let's hope that by the beginning of next year we stop losing jobs. That means that to get back to 5% unemployment within five years we need to see, on average, the creation of 250,000 jobs per month. As an AVERAGE!!!!!
Look at the table below. It is the number of jobs added or lost for the last ten years. Do you see a year that averaged 250,000? No.
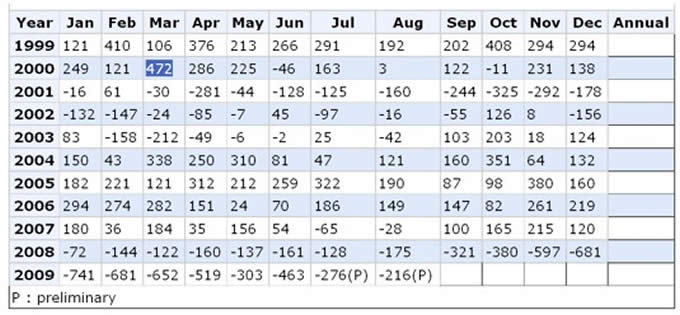
If you take the best year, which was 2006, you get an average monthly growth of 232,000. If you average the ten years from 1999, you get average monthly job growth of 50,000. If you take the average job growth from 1989 until now, you get an average of 91,000 a month. If you take the best ten years I could find, which would be 1991-2000, the average is still only 150,000. That is a long way from 250,000.
Want to get back to 4%? Add another 25,000 jobs a month to 2006.
Let's jump forward to next September. We will need at least 1.5 million jobs to take into account growth in the population. Plus another half million jobs that we are likely to lose before we start to grow again. What is the likelihood of average job growth of 160,000 a month? Anyone want to take the "overs" bet?
Go back to 2003, the year after the end of the last recession. A few hundred thousand jobs were created. Why so slow? Because employers gave more time to those who were already employed and to part-time workers. Because of the near-certain loss of jobs for the next few months and the slow recovery, it is a very real possibility that unemployment will still be well over 10% a year from now.
Even with robust growth of 200,000 jobs a month thereafter for the next two years, unemployment will still be close to or over 9%. That would only be an additional 1.8 million jobs (making the most optimistic assumptions) over the new jobs needed for population growth.
A Double-Dip Recession?
And that is before this administration makes the economically suicidal move to raise the top tax rate by 10%. The popular image is that those who pay the highest tax rate are Wall Street execs, bankers, and corporate moguls. The reality is that 75% of them are small business owners, and they are responsible for the large majority of new jobs that are going to be needed, not to mention a large part of consumer spending. If you tax them more you are going to get fewer jobs (as they will have less to invest) and less consumer spending.
A tax increase of the size being contemplated, with unemployment at today's level, will guarantee a double-dip recession, which of course means that unemployment will rise, not fall. Go back and look at that chart on unemployment. Notice the very steep rise in the second recession of the early '80s. That is what we could be facing.
Without getting too political, think about elections in 2010 with unemployment levels still rising. And fast-forward to 2012, with deficits (optimistically) projected to be almost $1 trillion and rising. With a tax increase giving us another recession? Will the bond market provide another $4 trillion? My question is, from where?
There has never been a period of serious inflation in the US without wage inflation. But real incomes are falling, and there is little reason to believe we will see wage pressures within the next few years. The opposite is likely to be the case.
Today's Wall Street Journal tells us that 5 million people have been unemployed for over 6 months. And the longer you are unemployed, the harder it is to get a job. That means you have to settle for a job with less income than you had before.
The only group to see a rise in employment? Those over the age of 55, as they have to take a job, any job, so they can save for retirement.
The Statistical Recovery
The economy is in the process of bottoming. The year-over-year comparisons are getting easier. We will find that new level of spending and economic activity and grow from there. But it is going to be awhile before we get back to full employment. While the numbers may say recovery, it is not going to feel like one.
Let's review quickly what I have written about the last four weeks. We have enormous excess capacity - capacity utilization is about 68%. Banks are cutting back on their loans, and consumers and businesses are borrowing less. Housing is likely to be in a funk for at least two years. We are deleveraging, which is causing the velocity of money to slow.
All of this is very deflationary. Will the Fed print enough money to reflate the economy? You better hope so. Will we have to deal with it later? Of course. We have no good choices. We are in for a long five years, at the least. Yes, there will be opportunities, and new industries will be created. But it won't happen overnight.
Welcome to the New Normal.
Birthdays, New Orleans, and then the Road Trip from Hell
Next weekend I celebrate my 60th birthday, and family and friends from around the world are flying in. We are going to party for at least 2-3 days. All I can say is, I have a very eclectic group of friends and it is going to be fun for all of us. If I write a letter, it will be earlier in the week.
I will be in New Orleans the following weekend, then start a 17-day trip with only a few nights in my bed, and every day a plane or new city. Although I enjoy traveling and meeting people, this may be a little much, though I must say I am looking forward to Argentina, Brazil, and Uruguay. It has been awhile since I have been south.
I stopped by to visit my #2 daughter (Melissa) last night. She works in a local watering hole while going to school. It is quite popular and is usually quite crowded. Last evening it was untypically quiet.
I asked, "What's up?" The manager and Melissa began talking about how slow things were getting, about how friends who were regulars had lost their jobs and had to move back in with parents. With few exceptions, it is slower than a few years ago everywhere I go. A recent Gallop poll said 71% of people are cutting back and 90% are watching what they are spending. 33% said their companies are cutting back on hiring.
Every poll or survey I see shows businesses deciding to cut back. Talking with my kids (the six who are young and in the work force), it is a rather difficult time. But then I think that I had to enter the workforce in 1975, not a very good year or decade. And we all made it, if not very easily. We lived very modestly (to say the least) for those first years.
And so it goes. Each generation has to learn how to deal with adversity and the problems of starting out. Many of those in my generation are now trying to figure out how to deal with a retirement that does not look nearly as comfortable as it did a few years ago.
I still hope we can Muddle Through.
Have a great week. I see parties, barbeque, golf, and lots of friends in my week ahead. And you make some time to enjoy life as well.
Your glad to get to 60 analyst,
By John Mauldin
John Mauldin, Best-Selling author and recognized financial expert, is also editor of the free Thoughts From the Frontline that goes to over 1 million readers each week. For more information on John or his FREE weekly economic letter go to: http://www.frontlinethoughts.com/learnmore
To subscribe to John Mauldin's E-Letter please click here:http://www.frontlinethoughts.com/subscribe.asp
Copyright 2008 John Mauldin. All Rights Reserved
John Mauldin is president of Millennium Wave Advisors, LLC, a registered investment advisor. All material presented herein is believed to be reliable but we cannot attest to its accuracy. Investment recommendations may change and readers are urged to check with their investment counselors before making any investment decisions. Opinions expressed in these reports may change without prior notice. John Mauldin and/or the staff at Millennium Wave Advisors, LLC may or may not have investments in any funds cited above. Mauldin can be reached at 800-829-7273.
Disclaimer PAST RESULTS ARE NOT INDICATIVE OF FUTURE RESULTS. THERE IS RISK OF LOSS AS WELL AS THE OPPORTUNITY FOR GAIN WHEN INVESTING IN MANAGED FUNDS. WHEN CONSIDERING ALTERNATIVE INVESTMENTS, INCLUDING HEDGE FUNDS, YOU SHOULD CONSIDER VARIOUS RISKS INCLUDING THE FACT THAT SOME PRODUCTS: OFTEN ENGAGE IN LEVERAGING AND OTHER SPECULATIVE INVESTMENT PRACTICES THAT MAY INCREASE THE RISK OF INVESTMENT LOSS, CAN BE ILLIQUID, ARE NOT REQUIRED TO PROVIDE PERIODIC PRICING OR VALUATION INFORMATION TO INVESTORS, MAY INVOLVE COMPLEX TAX STRUCTURES AND DELAYS IN DISTRIBUTING IMPORTANT TAX INFORMATION, ARE NOT SUBJECT TO THE SAME REGULATORY REQUIREMENTS AS MUTUAL FUNDS, OFTEN CHARGE HIGH FEES, AND IN MANY CASES THE UNDERLYING INVESTMENTS ARE NOT TRANSPARENT AND ARE KNOWN ONLY TO THE INVESTMENT MANAGER.
John Mauldin Archive |
© 2005-2022 http://www.MarketOracle.co.uk - The Market Oracle is a FREE Daily Financial Markets Analysis & Forecasting online publication.