


Stock Market S&P 500 Index Vulnerable to Downside Test of Lower Bollinger Band
Stock-Markets / Stock Index Trading Sep 26, 2009 - 06:24 PM GMTBy: Mike_Paulenoff

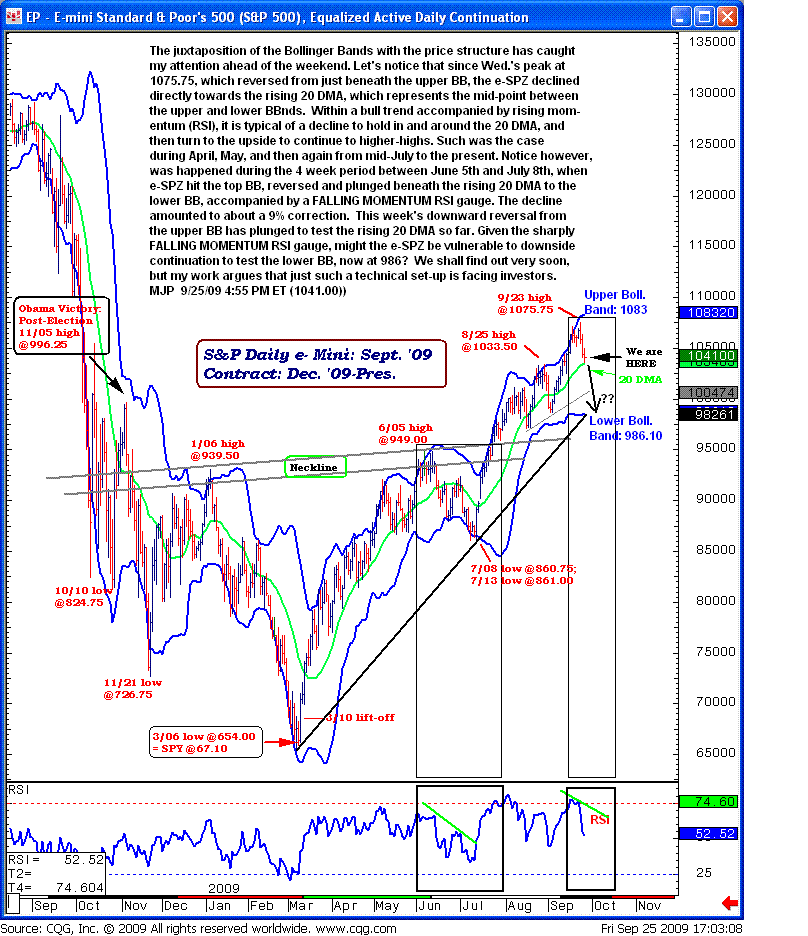
 The juxtaposition of the Bollinger Bands with the price structure has caught
my attention ahead of the weekend. Let¹s notice that since Wednesday¹s peak
at 1075.75, which reversed from just beneath the upper BB, the S&P 500 emini
price declined directly towards the rising 20-day moving average, which
represents the mid-point between the upper and lower BBnds. Within a bull
trend accompanied by rising momentum (RSI), it is typical of a decline to
hold in and around the 20 DMA and then turn to the upside to continue to
higher-highs. Such was the case during April, May and then again from
mid-July to the present.
The juxtaposition of the Bollinger Bands with the price structure has caught
my attention ahead of the weekend. Let¹s notice that since Wednesday¹s peak
at 1075.75, which reversed from just beneath the upper BB, the S&P 500 emini
price declined directly towards the rising 20-day moving average, which
represents the mid-point between the upper and lower BBnds. Within a bull
trend accompanied by rising momentum (RSI), it is typical of a decline to
hold in and around the 20 DMA and then turn to the upside to continue to
higher-highs. Such was the case during April, May and then again from
mid-July to the present.
Notice, however, what happened during the 4-week period between June 5 and July 8, when the emini S&P hit the top BB, reversed and plunged beneath the rising 20 DMA to the lower BB, accompanied by a falling momentum RSI gauge. The decline amounted to about a 9% correction. This week¹s downward reversal from the upper BB has plunged to test the rising 20 DMA so far. Given the sharply falling momentum RSI gauge, might the emini S&P and the S&P 500 Depository Receipts (SPY) for those following the ETF -- be vulnerable to downside continuation to test the lower BB, now 986? We shall find out very soon, but my work argues that just such a technical set-up is facing traders.
Sign up for a free 15-day trial to Mike's ETF Trading Diary today.
By Mike Paulenoff
Mike Paulenoff is author of the MPTrader.com (www.mptrader.com) , a real-time diary of Mike Paulenoff's trading ideas and technical chart analysis of
Exchange Traded Funds (ETFs) that track equity indices, metals, energy commodities, currencies, Treasuries, and other markets. It is for traders with a 3-30 day time horizon, who use the service for guidance on both specific trades as well as general market direction
© 2002-2009 MPTrader.com, an AdviceTrade publication. All rights reserved. Any publication, distribution, retransmission or reproduction of information or data contained on this Web site without written consent from MPTrader is prohibited. See our disclaimer.
Mike Paulenoff Archive |
© 2005-2022 http://www.MarketOracle.co.uk - The Market Oracle is a FREE Daily Financial Markets Analysis & Forecasting online publication.