Most Popular
1. It’s a New Macro, the Gold Market Knows It, But Dead Men Walking Do Not (yet)- Gary_Tanashian
2.Stock Market Presidential Election Cycle Seasonal Trend Analysis - Nadeem_Walayat
3. Bitcoin S&P Pattern - Nadeem_Walayat
4.Nvidia Blow Off Top - Flying High like the Phoenix too Close to the Sun - Nadeem_Walayat
4.U.S. financial market’s “Weimar phase” impact to your fiat and digital assets - Raymond_Matison
5. How to Profit from the Global Warming ClImate Change Mega Death Trend - Part1 - Nadeem_Walayat
7.Bitcoin Gravy Train Trend Forecast 2024 - - Nadeem_Walayat
8.The Bond Trade and Interest Rates - Nadeem_Walayat
9.It’s Easy to Scream Stocks Bubble! - Stephen_McBride
10.Fed’s Next Intertest Rate Move might not align with popular consensus - Richard_Mills
Last 7 days
It's Five Nights at Freddy's Again! - 12th Jan 25
Squid Game Stock Market 2025 - 5th Jan 25
Stock Market Bubble Drivers, Crypto Exit Strategy During Musk Presidency - 27th Dec 24
Gold Stocks’ Remain Exceptionally Weak Even as Stocks Rise - 27th Dec 24
Gold’s Remarkable Year - 27th Dec 24
Stock Market Rip the Face Off the Bears Rally! - 22nd Dec 24
STOP LOSSES - 22nd Dec 24
Fed Tests Gold Price Upleg - 22nd Dec 24
Stock Market Sentiment Speaks: Why Do We Rely On News - 22nd Dec 24
Never Buy an IPO - 22nd Dec 24
THEY DON'T RING THE BELL AT THE CRPTO MARKET TOP! - 20th Dec 24
CEREBUS IPO NVIDIA KILLER? - 18th Dec 24
Nvidia Stock 5X to 30X - 18th Dec 24
LRCX Stock Split - 18th Dec 24
Stock Market Expected Trend Forecast - 18th Dec 24
Silver’s Evolving Market: Bright Prospects and Lingering Challenges - 18th Dec 24
Extreme Levels of Work-for-Gold Ratio - 18th Dec 24
Tesla $460, Bitcoin $107k, S&P 6080 - The Pump Continues! - 16th Dec 24
Stock Market Risk to the Upside! S&P 7000 Forecast 2025 - 15th Dec 24
Stock Market 2025 Mid Decade Year - 15th Dec 24
Sheffield Christmas Market 2024 Is a Building Site - 15th Dec 24
Got Copper or Gold Miners? Watch Out - 15th Dec 24
Republican vs Democrat Presidents and the Stock Market - 13th Dec 24
Stock Market Up 8 Out of First 9 months - 13th Dec 24
What Does a Strong Sept Mean for the Stock Market? - 13th Dec 24
Is Trump the Most Pro-Stock Market President Ever? - 13th Dec 24
Interest Rates, Unemployment and the SPX - 13th Dec 24
Fed Balance Sheet Continues To Decline - 13th Dec 24
Trump Stocks and Crypto Mania 2025 Incoming as Bitcoin Breaks Above $100k - 8th Dec 24
Gold Price Multiple Confirmations - Are You Ready? - 8th Dec 24
Gold Price Monster Upleg Lives - 8th Dec 24

Market Oracle FREE Newsletter

How to Protect your Wealth by Investing in AI Tech Stocks

How a Kid With a Ruler Can Make a Million - A Lesson in Drawing and Using Trendlines

InvestorEducation / Learn to Trade Sep 26, 2009 - 02:38 AM GMT

By: EWI

InvestorEducation

Best Financial Markets Analysis ArticleJeffrey Kennedy writes: The following article is adapted from a brand-new 50-page ebook from Elliott Wave International. Learn more about The Ultimate Technical Analysis Handbook, and download your free copy here.


When I began my career as an analyst, I was lucky enough to have some time with a few old pros.

One in particular that I will always remember told me that a kid with a ruler could make a million dollars in the markets. He was talking about trendlines. I was sold.

I spent nearly three years drawing trendlines and all sorts of geometric shapes on price charts. And you know, that grizzled old trader was only half right.

Trendlines are one the most simple and dynamic tools an analyst can employ... but I have yet to make my million dollars, so he was wrong -- or at least early -- on that point.

Despite being extremely useful, trendlines are often overlooked. I guess it’s just human nature to discard the simple in favor of the complicated.

(Heaven knows, if they don’t understand it, it must work, right?)
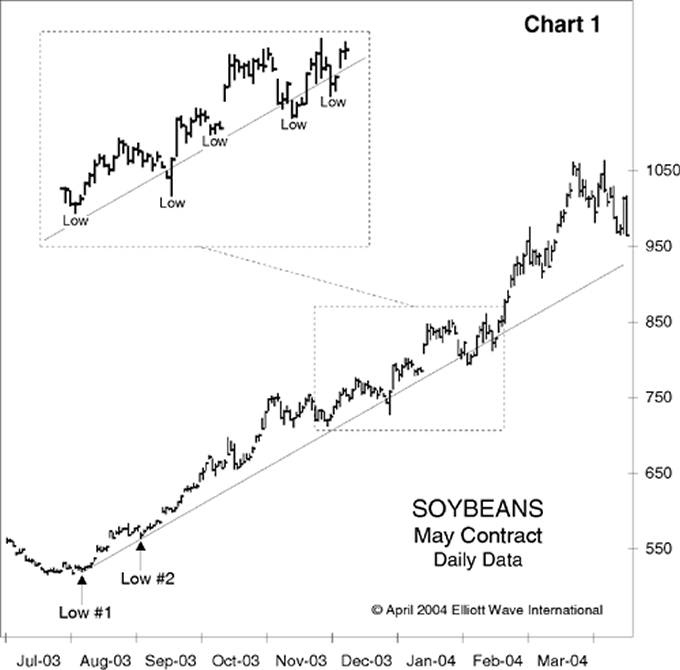
In the chart above, I have drawn a trendline using two lows that occurred in early August and September of 2003.

As you can see, each time prices approached this line, they reversed course and advanced.

Sometimes, soybeans only fell to near this line before turning up.

Other times, prices broke through momentarily before resuming the larger uptrend.

What still amazes me is that two seemingly insignificant lows in 2002 pointed the direction of soybeans -- and identified several potential buying opportunities -- for the next six months!

Get more lessons like the one above in the free 50-page Ultimate Technical Analysis Handbook. Learn more and download your free copy here.

Jeffrey Kennedy is the Chief Commodity Analyst at Elliott Wave International (EWI). With more than 15 years of experience as a technical analyst, he writes and edits Futures Junctures, EWI's premier commodity forecasting service. 


© 2005-2022 http://www.MarketOracle.co.uk - The Market Oracle is a FREE Daily Financial Markets Analysis & Forecasting online publication.


Post Comment

Only logged in users are allowed to post comments. Register/ Log in