


Stock Market Rally Mission Accomplished
Stock-Markets / Stocks Bear Market Sep 25, 2009 - 12:07 AM GMTBy: Guy_Lerner

 Now that the stock market has moved over 50% higher in the past 6 months, there are two words that would best describe where we are now: "mission accomplished". Of course, we all remember President George W. Bush in the early months of the Iraq War standing on the deck of a Navy ship with those two words emblazoned on a banner in the background. Little did we know, that "mission accomplished" really meant mission just getting started. In any case, I use those words because the Federal Reserve and Treasury have engineered a recovery and in particular, a stock market recovery, that has brought prices back to levels seen in early October, 2008 when Lehman Brothers collapsed sending the world economy into a tailspin (sic: sorry words of the "media").
Technically, this also seems to be case when looking at the major indices. Equities are not only back to the days when Lehman collapsed, but they are also filling the gap when the stock market (i.e., S&P500) fell over 18% in one week. It's "mission accomplished". The Fed has managed to bail out Wall Street again.
Please review the methodology and the significance of the key price levels by clicking on this link.
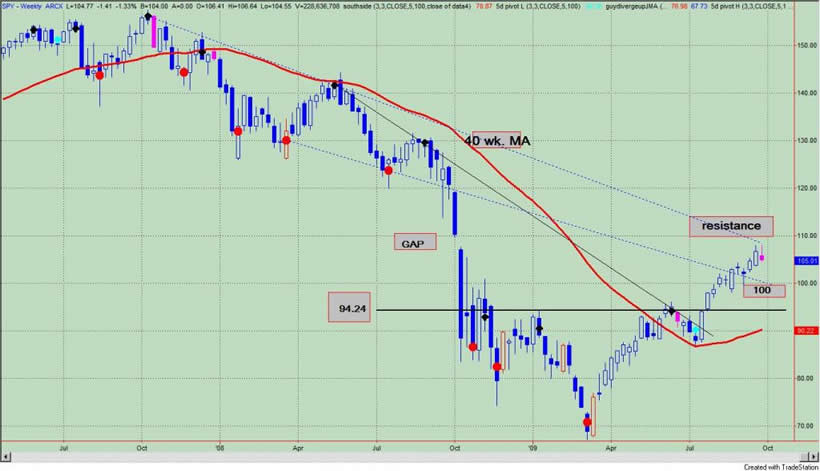
A weekly chart of the S&P Depository Receipts (symbol: SPY) is shown in figure 1. Prices almost filled the gap, and with the down sloping trend line drawn from the October, 2007 highs, it looks like the 108 to 110 area will be the highs and continue to provide resistance. For the record, the gap was not filled, and it only missed by a little more than 1.5 points. Let's call this "almost mission accomplished". On the downside, there is support at 100, but the best buying point would be at the 94.24 level or the July, 2009 breakout point which was from the very solid base formation. I would not be surprised to see the market correct to this area at some point as these "moonshots" that are fueled by short covering have a tendency to give back all their gains.
Figure 1. SPY/ weekly
A weekly chart of the Diamond Trusts (symbol: DIA) is shown in figure 2. Here the gap is far from being filled and prices have yet to get to the down sloping trend line. The gap will be filled at 103.09. For the DIA, it is "mission not accomplished", but when dealing with the stock market, nothing is ever perfect. 93.28 would be a mini pullback, and a better buying point would be a pullback to the 87.5 - 88.5 zone.
Figure 2. DIA/ weekly
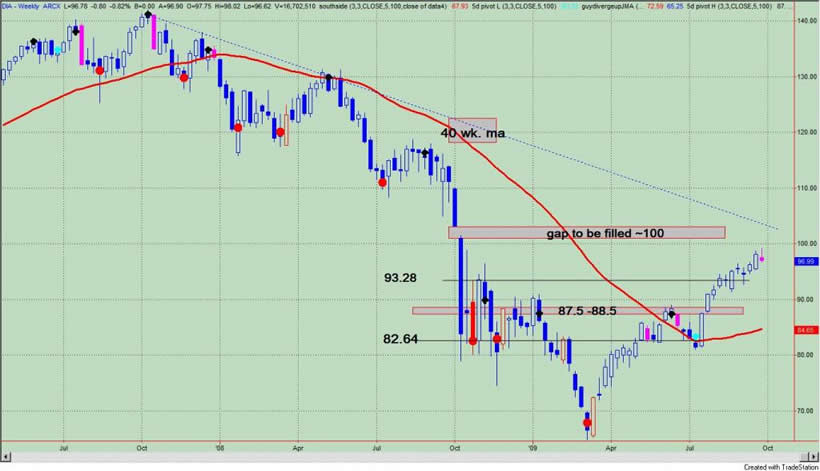
Figure 3 is a weekly chart of the Power Shares QQQ Trust (symbol: QQQQ). Our relative strength leader the past 6 months, the QQQQ, has already broken out of its down trend from the October, 2007 highs. Prices have hit the resistance zone between 42 and 43.60; these are the levels seen at the time of Lehman's collapse. So this is "mission accomplished". Good job, boys! A mini pullback to 40 would keep prices within the up trend channel and above the negative divergence price bar (labeled with pink), which will tend to act as a support level. A better spot would be 36.72, which is the level seen in July, 2009 just prior to our short covering moonshot.
Figure 3. QQQQ/ weekly
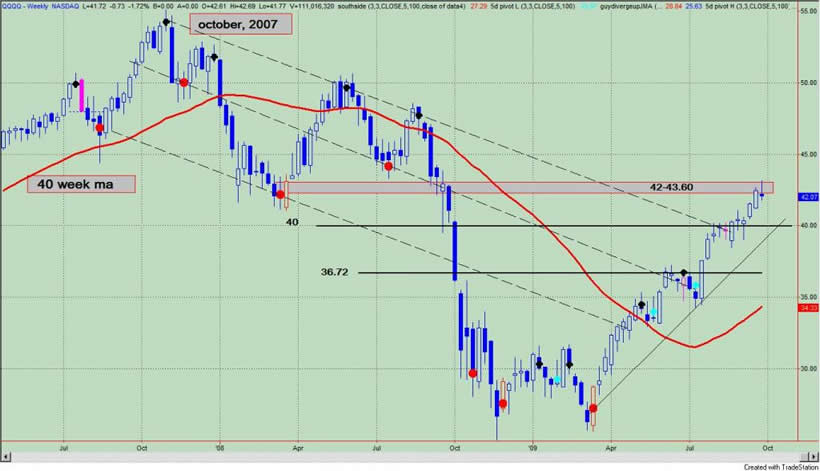
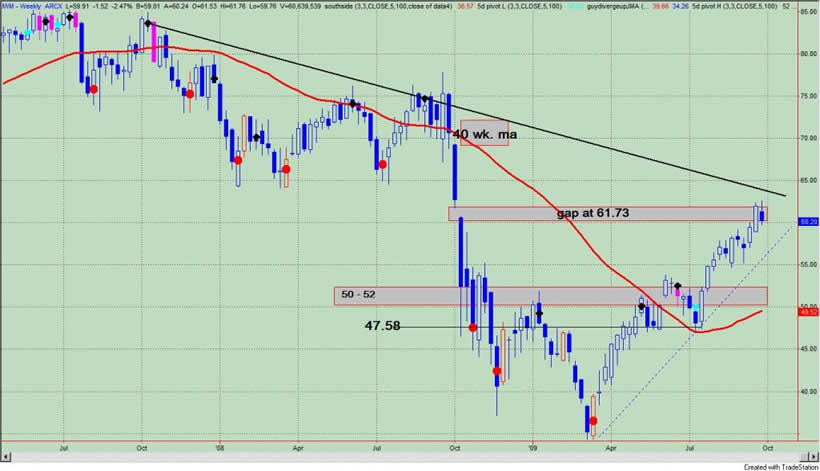
Figure 4 is a weekly chart of the i-Shares Russell 2000 Index (symbol: IWM). The gap at 61.73 was filled and the down trend line has yet to be violated. Another "mission accomplished". The zone between 50 - 52 is the first area of support, but before thinking of that, it should be noted that IWM is still within an uptrend channel.
Figure 4. IWM/ weekly
Although it is too soon to call a top, it should be noted that there is significant resistance nearby and overhead in the major indices. It is "mission accomplished" as the market now approaches price levels seen at the time of the Lehman crisis. There probably is a lot of back slapping going around at the Fed and Treasury Department these days as the markets risen on a flood of liquidity. Over $2 trillion dollars of US household net worth was created in the last 6 months. Wow! We even had President Obama taking a victory lap on all the talk shows this week. The Fed and Treasury Department have done a great job pulling it off, but somehow I have the feeling that 6 years from now we will look back at this time and say "that wasn't 'mission accomplished'; that was 'mission just getting started.'"
By Guy Lerner
http://thetechnicaltakedotcom.blogspot.com/
Guy M. Lerner, MD is the founder of ARL Advisers, LLC and managing partner of ARL Investment Partners, L.P. Dr. Lerner utilizes a research driven approach to determine those factors which lead to sustainable moves in the markets. He has developed many proprietary tools and trading models in his quest to outperform. Over the past four years, Lerner has shared his innovative approach with the readers of RealMoney.com and TheStreet.com as a featured columnist. He has been a regular guest on the Money Man Radio Show, DEX-TV, routinely published in the some of the most widely-read financial publications and has been a marquee speaker at financial seminars around the world.
© 2009 Copyright Guy Lerner - All Rights Reserved
Disclaimer: The above is a matter of opinion provided for general information purposes only and is not intended as investment advice. Information and analysis above are derived from sources and utilising methods believed to be reliable, but we cannot accept responsibility for any losses you may incur as a result of this analysis. Individuals should consult with their personal financial advisors.
Guy Lerner Archive |
© 2005-2022 http://www.MarketOracle.co.uk - The Market Oracle is a FREE Daily Financial Markets Analysis & Forecasting online publication.