U.S. Dollar Up While Crude Oil Slips
Currencies / US Dollar Sep 24, 2009 - 10:31 AM GMTBy: Mike_Paulenoff
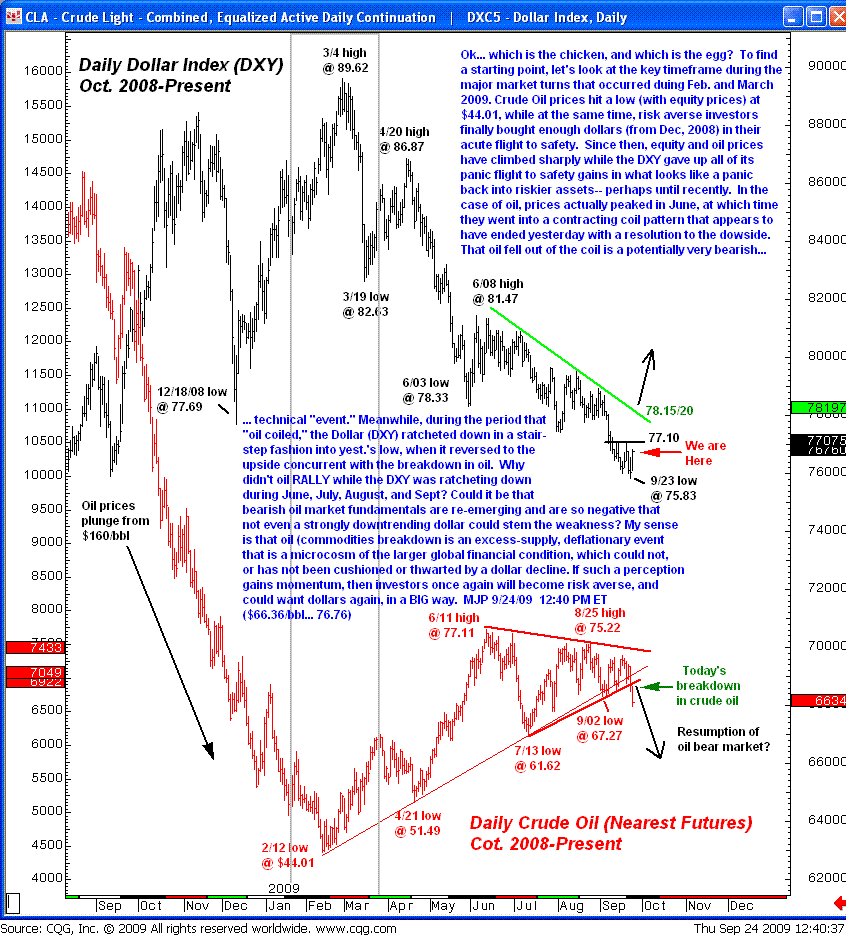
 Ok... which is the chicken, and which is the egg? To find a starting point, let's look at the key timeframe during the major market turns that occurred duing Feb. and March 2009. Crude Oil prices hit a low (with equity prices) at $44.01, while at the same time risk averse investors finally bought enough dollars (from Dec, 2008) in their acute flight to safety. Since then, equity and oil prices have climbed sharply, while the daily Dollar index (DXY) gave up all of its panic flight to safety gains in what looks like a panic back into riskier assets-- perhaps until recently. In the case of oil and the US Oil Fund ETF (USO), prices actually peaked in June, at which time they went into a contracting coil pattern that appears to have ended yesterday with a resolution to the dowside.
That oil fell out of the coil is a potentially very bearish... ... technical "event." Meanwhile, during the period that "oil coiled," the Dollar (DXY) ratcheted down in a stair- step fashion into yest.'s low, when it reversed to the upside concurrent with the breakdown in oil. Why didn't oil RALLY while the DXY was ratcheting down during June, July, August, and Sept? Could it be that bearish oil market fundamentals are re-emerging and are so negative that not even a strongly downtrending dollar could stem the weakness?
My sense is that oil (commodities breakdown is an excess-supply, deflationary event that is a microcosm of the larger global financial condition, which could not, or has not been cushioned or thwarted by a dollar decline. If such a perception gains momentum, then investors once again will become risk averse, and could want dollars again, in a BIG way. MJP 9/24/09 12:40 PM ET ($66.36/bbl... 76.76)

Sign up for a free 15-day trial to Mike's ETF Trading Diary today.
By Mike Paulenoff
Mike Paulenoff is author of the MPTrader.com (www.mptrader.com) , a real-time diary of Mike Paulenoff's trading ideas and technical chart analysis of
Exchange Traded Funds (ETFs) that track equity indices, metals, energy commodities, currencies, Treasuries, and other markets. It is for traders with a 3-30 day time horizon, who use the service for guidance on both specific trades as well as general market direction
© 2002-2009 MPTrader.com, an AdviceTrade publication. All rights reserved. Any publication, distribution, retransmission or reproduction of information or data contained on this Web site without written consent from MPTrader is prohibited. See our disclaimer.
Mike Paulenoff Archive |
© 2005-2022 http://www.MarketOracle.co.uk - The Market Oracle is a FREE Daily Financial Markets Analysis & Forecasting online publication.


