Wealthbuilder Quarterly Stock Market Brief and Stock Pick
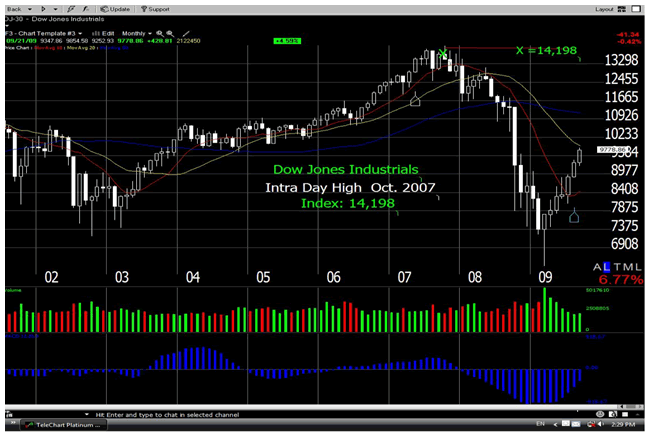
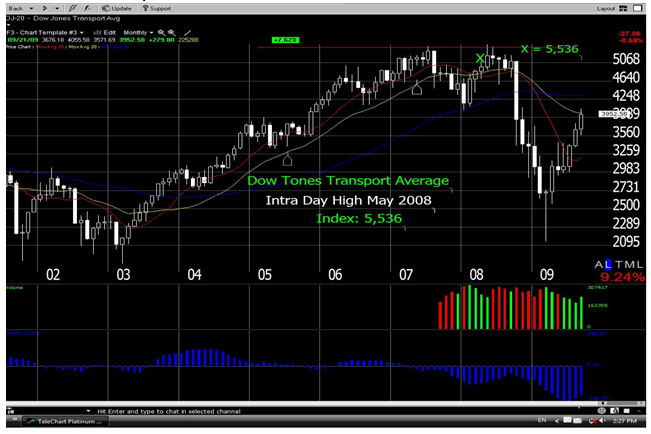
Stock-Markets / Dow Theory Sep 22, 2009 - 01:54 PM GMT The monthly charts of the Dow Industrials and the Dow Transports are most revealing as they allow one immediately get a long term perspective on the current market situation. The Dow 30 hit an intraday high in October of 2007 touching 14,198. The Dow 20 got there in May 2008 hitting 5,536.
The current Dow Industrial and Transport "highs" can thus rise by a further 45% and 40% respectively before the matter of a new "Bull" economy can really be decided upon ( based on classic Dow Theory that is). Yes we are definitely in a "bull" trend but we are most certainly not in a bull market. For a new bull market to be in place the indices must reach higher highs and higher lows, off the 2007 and 2008 highs, and both movements must confirm.
Dow Jones 30 Industrial Index: One Month Chart 2002 - 2009

Dow Jones 20 Transport Index: One Month Chart 2002 - 2009

Now "the trend is your friend" and must be traded on by active market participants. For me a tradeable trend is one where both Dow indices give me higher highs and higher lows, on three day charts. Such a trend commenced in March of this year. So far this trend has not failed. It was tested by the Dow 30 but was not confirmed by the transports. The trend thus stayed in place and you remain invested until both averages confirm otherwise. They are the rules and I use them. However, such a trend should not be invested in "on a buy and hold regardless basis". Nobody can have fundamental confidence in this market. The theory thus indicates we have a trending, capital gain making, opportunity but not a safe, income generating, economic boom.
Momentum alone does not remake a shattered economic structure. Sooner or later the rubber has to hit the road. When it does, the smart money will know what technical trigger to use to short in unison on the downside. They will be ready. You should be alert . A perfect position for such a test would be the previous all-time highs. Inability to break this psychological barrier would be serious. Look to the Transports first for an early indication. Currently we are in no-mans land. There is plenty of technical up-side and substantial fundamental down-side and earnings season is upon us. Therefore "all is well", provided the trend holds. It's as simple as that. Any other thinking will cause you paralysis by analysis.
Short to mid-term, any forceful downside movement could be sharp and will put some manners on unbridled optimism. Therefore trade with hard technical sell-stops should you enter on weakness or desire to protect up-trending profits. The severity of any ensuing technical damage will dictate how long the market will take to lick its wounds and consolidate. The longer this latter phase lasts the better in my opinion as it will allow the real economy an opportunity to regroup and rebuild and rematrix. Ideally a substantially lower dollar (in effect a phased re-valuation of the currency) would be a great boost to America for it would promote inward investment in real estate and other capital assets by foreign entities. Such inward investment is sadly needed.
However, with the indices so far off their former highs of 2007 and 2008, we could be waiting a little longer for any significant correction. The Over The Counter (OTC) "masters" on Wall Street, the Contract For Difference (CFD) "spartans" in London, the spread-betting (SB) "ninjas" in Hong Kong and the Exchange Traded Fund (ETF) "gurus" in New Jersey may decide to hold off on their delivery of a hyper leveraged reality check. They may thus continue to let us believe a little longer there are no such things as joblessness, under-employment, economic velocity collapse, mall malaise, derivative dysfunction, American production obsolescence, wage-rate shrinkage, and private and corporate credit disintegration. Life must go on for sure but will consistent compounded EARNING, that is the sixty four hundred billion dollar question that has remained unanswered since 18th. January 2000.
Stock Pick
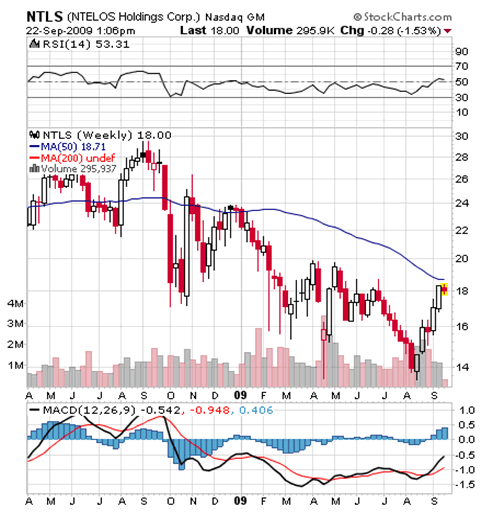
NTELOS Holdings
Ticker: NTLS
Ntelos is an integrated communications provider, offering wireless and wireline services to consumers and businesses in 7 Mid-Atlantic States.
On the heels of a solid top and bottom-line advance in 2008 this Telco is taking brilliant advantage of solid subscriber growth. New product offerings and network upgrades planned for the year ahead ought to help boost market share and retain subscribers.

Fundamentals:
Div Yield: 6%
P/E: 11.2
Ret. On Shr. Equity: 29%
Fin. Strength: B
By Christopher M. Quigley
B.Sc., M.M.I.I. Grad., M.A.
http://www.wealthbuilder.ie
Mr. Quigley is 46 years of age and holds a Batchelor Degree in Management from Trinity College/College of Commerce, Dublin and is a graduate of the Marketing Institute of Ireland. He commenced investing in the Stock Market in San Francisco, California where he lived for 6 years. Now based in Dublin, Mr. Quigley actively trades utilising the principles set out in the modules above. This Wealthbuilder course has been developed over the last 9 years as a result of research, study, experience and successful application.
Disclaimer: The above is a matter of opinion provided for general information purposes only and is not intended as investment advice. Information and analysis above are derived from sources and utilising methods believed to be reliable, but we cannot accept responsibility for any trading losses you may incur as a result of this analysis. Individuals should consult with their personal financial advisors before engaging in any trading activities.
Christopher M. Quigley Archive |
© 2005-2022 http://www.MarketOracle.co.uk - The Market Oracle is a FREE Daily Financial Markets Analysis & Forecasting online publication.


