What GE's Chart Tells About SPY
Stock-Markets / Stock Index Trading Sep 21, 2009 - 01:34 PM GMTBy: Mike_Paulenoff
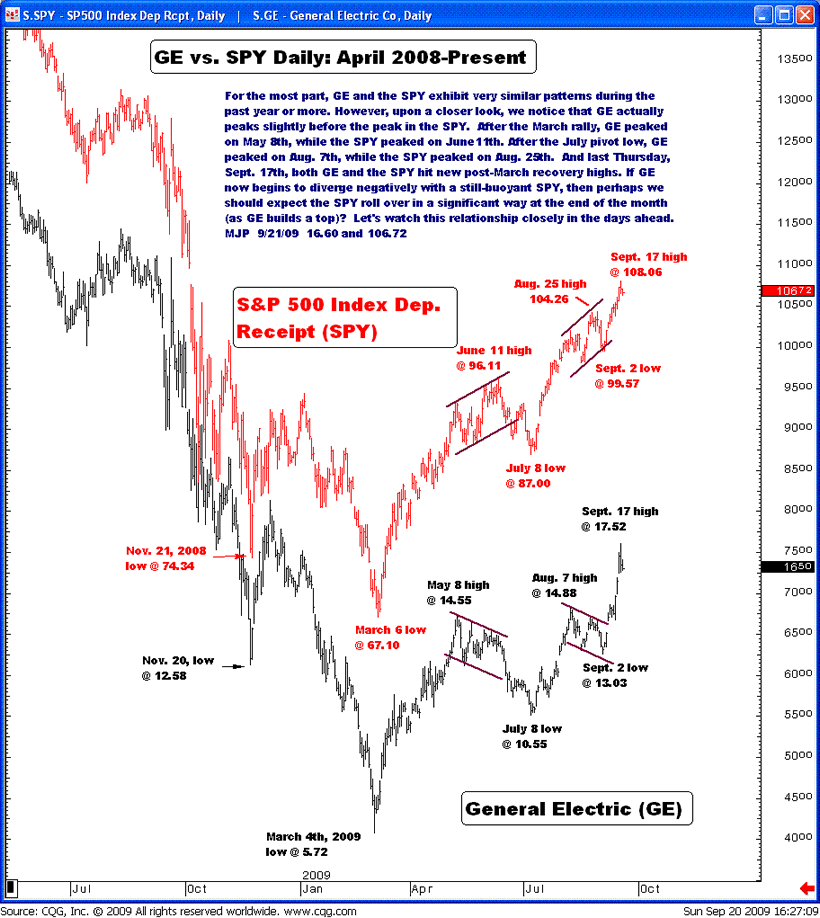
For the most part General Electric (GE) and the S&P 500 Depository Receipts (AMEX: SPY) exhibit very similar patterns during the past year or so. However, upon a closer look, we notice that GE actually peaks slightly before the peak in the SPY. After the March rally, GE peaked on May 8, while the SPY peak on June 11.
After the July pivot low, GE peak on Aug 7, while the SPY peaked on Aug 25. And last Thursday, Sep 17, both GE and SPY hit new post-March recovery highs. If GE now begins to diverge negatively with a still-buoyant SPY, then perhaps we should expect the SPY to roll over in a significant way at the end of the month (as GE builds a top)? Let’s watch this relationship closely in the days ahead.

Sign up for a free 15-day trial to Mike's ETF Trading Diary today.
By Mike Paulenoff
Mike Paulenoff is author of the MPTrader.com (www.mptrader.com) , a real-time diary of Mike Paulenoff's trading ideas and technical chart analysis of
Exchange Traded Funds (ETFs) that track equity indices, metals, energy commodities, currencies, Treasuries, and other markets. It is for traders with a 3-30 day time horizon, who use the service for guidance on both specific trades as well as general market direction
© 2002-2009 MPTrader.com, an AdviceTrade publication. All rights reserved. Any publication, distribution, retransmission or reproduction of information or data contained on this Web site without written consent from MPTrader is prohibited. See our disclaimer.
Mike Paulenoff Archive |
© 2005-2022 http://www.MarketOracle.co.uk - The Market Oracle is a FREE Daily Financial Markets Analysis & Forecasting online publication.


