Inflation Pressures Rising Again
Stock-Markets / US Dollar Sep 21, 2009 - 10:14 AM GMTBy: Guy_Lerner
Several months ago I began to lay out an asset allocation road map. In a nutshell, the US Dollar remains the key asset to follow, and as long as the Dollar remains in a downtrend, then commodities should outperform equities with Treasuries bringing up the rear. In those articles, I never really stated why I like commodities over equities.
I think we can all agree (for now) that as the Dollar Index goes so go equities and commodities. If the Dollar goes down, the other two assets should go up. If the Dollar goes up, they go down (like today's action). But equities face another headwind, and it is inflation as measured by the trends in gold, crude oil and yields on the 10 year Treasury bond. When the trends in gold, crude oil and 10 year Treasury yields are strong, then equities should under perform, and this is why I see commodities outperforming over the long term. Both commodities and equities may sell off on Dollar strength, but until the trend of the Dollar is higher, then equities will continue to lag commodities as repeated spikes in inflation (real or perceived) over many months will eventually chip away at the gains made in equities.
For the record, I would not call a reversal of the intermediate downtrend in the Dollar Index until there is a weekly close above 79.46, and this may change depending upon this week's price action.
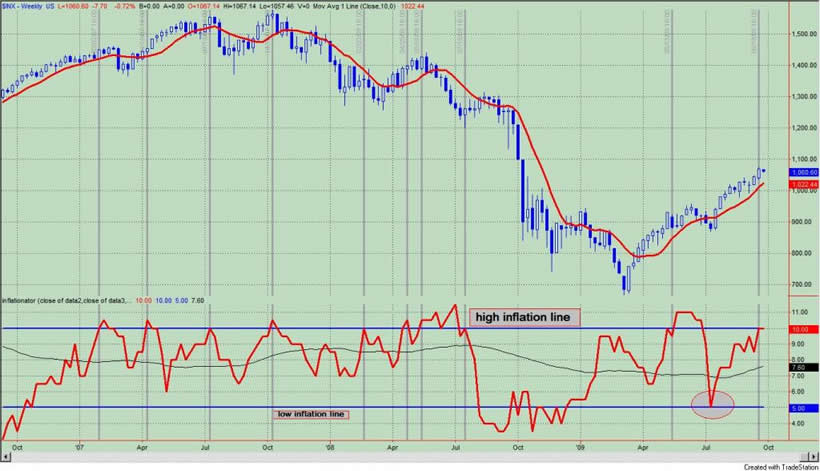
Figure 1 is a weekly chart of the S&P500, and the indicator in the lower panel is a composite indicator that assesses the strength of the trends in crude oil, gold, and 10 year Treasury yields. When the indicator is above the upper line (i.e., high inflation zone) that means that these trends are strong and inflationary pressures (real or perceived) are rising. Under this scenario, equities face a headwind and should under perform.
Figure 1. SP500 v. Inflation Indicator/ weekly

For those interested in exploring how (real or perceived) inflation pressures effect equities, as measured by our indicator, please check out this link. I designed a study that asked the simple question of how stocks performed when the indicator was in the high inflation zone as it is now. The results are enlightening and cover about 25 years of data.
On figure 1, the vertical gray lines highlight recent past extremes in the indicator. Of note, the 2009 extremes in the indicator occurred during the recent bull run. The first led to a 1 week sell off where the S&P500 lost 4.99%; this was from May 8 to May 15. The second saw the S&P500 go essentially flat line (i.e., it made a 1% gain in 6 weeks) from May 22 until July 3. Even during this bull run, strong trends in gold, crude oil, and 10 year Treasury yields have slowed the advance of stocks. And as a corollary to all of this, the markets found a short term bottom in mid-July once the indicator hit the low inflation line. See the gray oval in figure 1.
The bottom line: inflation pressures -real or perceived- do matter. Over the long haul in this environment of Dollar devaluation, commodities should out perform equities.
By Guy Lerner
http://thetechnicaltakedotcom.blogspot.com/
Guy M. Lerner, MD is the founder of ARL Advisers, LLC and managing partner of ARL Investment Partners, L.P. Dr. Lerner utilizes a research driven approach to determine those factors which lead to sustainable moves in the markets. He has developed many proprietary tools and trading models in his quest to outperform. Over the past four years, Lerner has shared his innovative approach with the readers of RealMoney.com and TheStreet.com as a featured columnist. He has been a regular guest on the Money Man Radio Show, DEX-TV, routinely published in the some of the most widely-read financial publications and has been a marquee speaker at financial seminars around the world.
© 2009 Copyright Guy Lerner - All Rights Reserved
Disclaimer: The above is a matter of opinion provided for general information purposes only and is not intended as investment advice. Information and analysis above are derived from sources and utilising methods believed to be reliable, but we cannot accept responsibility for any losses you may incur as a result of this analysis. Individuals should consult with their personal financial advisors.
Guy Lerner Archive |
© 2005-2022 http://www.MarketOracle.co.uk - The Market Oracle is a FREE Daily Financial Markets Analysis & Forecasting online publication.


