


New Research Suggests Stocks and Warrants Going Higher, Gold less so
Stock-Markets / Financial Markets 2009 Sep 20, 2009 - 07:23 PM GMTBy: Lorimer_Wilson

 New research by Morgan Stanley Europe and Merrill Lynch Asia confirms old moving average based research by Stan Weinstein that the on-going upswing in the S&P 500 and other market indices around the world quite possibly has much further to go in this current bull run albeit with some volatility along the way. That could well have negative implications for the short-term price of gold bullion but, fortunately for the ‘gold bugs’ to be found in every room, continuing bright prospects for the stocks and warrants of gold and silver mining and royalty companies are expected.
Below is this week’s table showing the relatively poor performance of gold YTD (albeit not so for silver!) as compared to the HUI, GDM and CDNX in spite of closing above $1000 for the second consecutive week. Also note that the relatively unknown and misunderstood asset class of long-term warrants associated with commodity-related companies is up 178% YTD and should continue to escalate as their underlying stock continues to benefit from continued strength in the broader stock market.
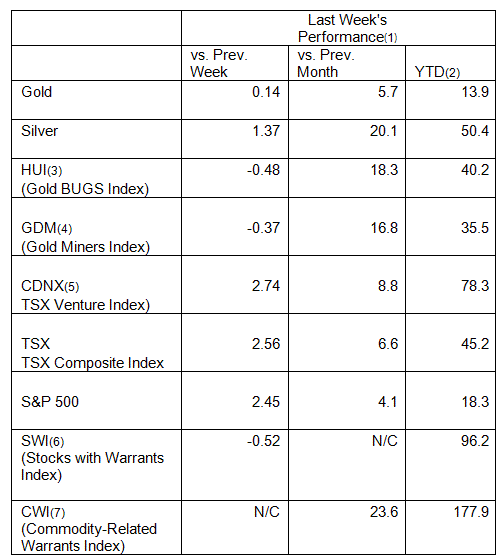
(1) All calculations are based on U.S. dollar equivalents
(2) Week ending September 18h, 2009
(3)HUI is the symbol of the AMEX Gold BUGS Index consisting of a Basket of Unhedged Gold Stocks. It is a modified equal dollar-weighted index of 15 large/mid cap gold mining companies that do not hedge their gold beyond 1.5 years.
(4)GDM is the symbol for the NYSE Arca Gold Miners Index. It is a modified market capitalization weighted index of 31 large/mid/small cap gold and silver mining companies.
(5)CDNX is the symbol for the S&P/TSX Venture Composite Index. It consists of 558 micro and nano cap companies of which 44% are engaged in the mining, exploration and/or development of gold and/or silver and other mineral resources and 18% in oil or natural gas pursuits.
(6)SWI is my proprietary commodity-related Stocks with Warrants Index. The SWI consists of all such warrants with at least 24 months duration outstanding trading on the Canadian and U.S. stock exchanges. Of the current 35 companies in the index 4 are large-cap, 4 mid-cap, 4 small-cap and 23 are micro- or nano-cap in size. The index represents 20 gold/silver/copper mining and/or royalty companies, 9 miscellaneous mining companies, 2 oil and gas operators, 3 merchant banks and 1 mutual fund.
(7)CWI is my proprietary Commodity-related Warrants Index. It consists of 47 warrants, of at least 24 months duration, associated with the 35 SWI companies.
Sources: preciousmetalswarrants.com (warrant and stocks-with-warrants data), oanda.com (exchange rates) and stockcharts.com (index and commodity prices).
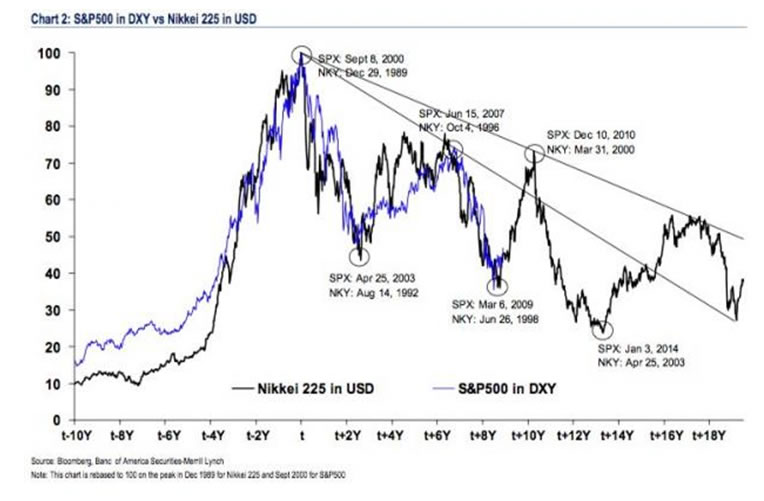
Those who adhere to Stan Weinstein’s 4-stage technical approach to determining market trends, as put forth in his book “Secrets for Profiting in Bull and Bear Markets” are not surprised by the research put forth by Morgan Stanley Europe and Merrill Lynch Asia. Alan Saunders of ShareHunters.com did such an excellent job of summarizing Weinstein’s “Stage Analysis” approach to market timing in an article he wrote years ago(1) that I have quoted from it liberally to supplement my application of Weinstein’s analysis, Morgan Stanley Europe’s research findings(2) of what unfolded, on average, in the wake of 19 historical secular bear markets and Merrill Lynch Asia’s post-dated comparison(3), based on an article(4) by Boris Chikvashvili, of the performance of the S&P 500 with that of the Nikkei 225. It makes for a perfect follow-up to my recent article posted on this site entitled “Nikkei Comparison Suggests S&P 500 of 1400 by End of 2010 – and 400 by 2014”.
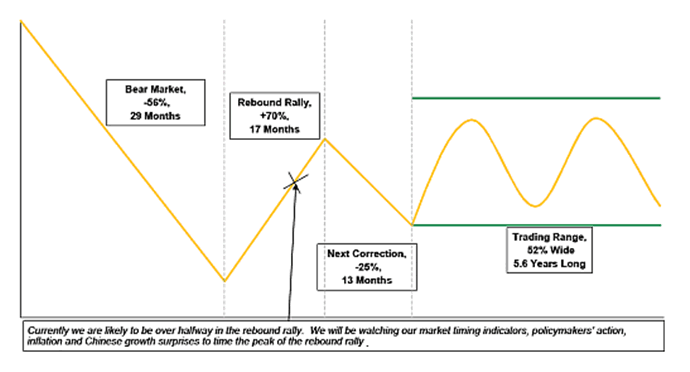
Weinstein describes and explains what is transpiring in the marketplace at each stage of the market cycle i.e. The Basing Area or accumulation (Stage 1); The Advancing Phase or uptrend (Stage 2); The Top Area or distribution phase (Stage 3) and finally, The Decline or downtrend (Stage 4). Morgan Stanley Europe’s findings bring some practical application to his analyses. Below are charts showing Weinstein’s interpretation of the ebb and flow of the markets (Source: ShareHunter.com article) and Morgan Stanley Europe’s depiction of the typical secular bear market and its aftermath.
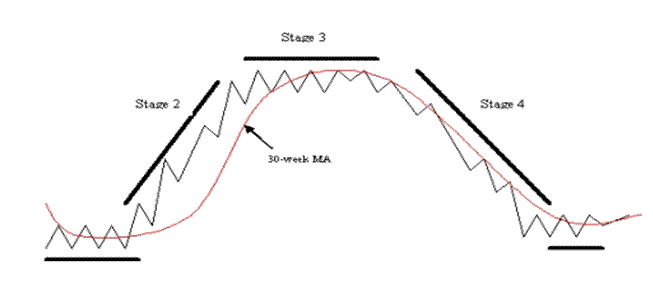
While Weinstein’s chart above starts with the uptrend (Stage 2) the Morgan Stanley chart below starts with the Bear Market (Stage 4). The Weinstein stages are based on an assessment of market dynamics while the Morgan Stanley chart depicts the actual reality of it all.
The Four Stages of the Typical Secular Bear Market and its Aftermath
Stage 1 – The Base Area
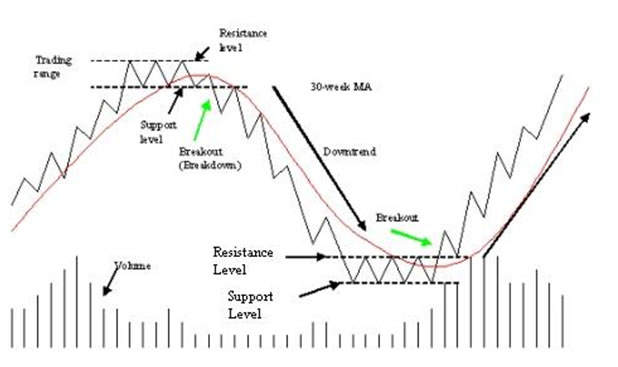
In Weinstein’s Basing Area, or accumulation period, as buyers and sellers start to move into equilibrium the 30-week (210 day) moving average (MA) loses its downward slope and starts to flatten out. In addition, intermittent rallies and declines move prices above and below the MA. This basing area can go on, according to Weinstein, for months, if not for years in some cases. Indeed, according to Morgan Stanley Europe’s findings, this trading range lasts, on average, 5.6 years. Below is a chart showing the Weinstein stages with basic technical terms applied to the full cycle.
In Weinstein’s Advancing Phase, or uptrend, the 30-week MA starts to curve upwards, slightly at first, and this is followed by consecutively higher highs and higher lows as more buying takes place and others take their profits, albeit too soon. There will always be downside corrections mixed in with the rises but as long as the trend line is above the 30-week MA there is no need, according to Weinstein, to worry or to exit the market as all is in order and the market is going even higher.
As the months proceed more and more investors become aware of the rising trend and jump in. Eventually the trend line will start to sag closer to its MA and the angle of the ascent of the MA will start to slow down, the market becomes over-extended and is no longer a buy although still a hold for those who bought in at the start of Stage 2.
Morgan Stanley Europe refers to this stage as a rebound or counter-rally trend and their analysis of 19 historical secular bear markets reveals that the markets go up an average of 70% in, on average, 17 months. Looking at the present situation with the MSCI World Index up approximately 73% and the S&P 500 Index up approximately 58% since the lows of March 9th, Morgan Stanley concludes: “If the aftermath of these 19 secular bear markets is anything to go by, the current rally could go a bit higher, is likely to stall a few months before the first Fed rate hike, which we expect in Q3 of 2010 … and is likely to be followed by some sort of trading range for years to come because of structural problems of financial sector and household deleveraging as well as the poor state of government finances.”
As the above suggests, while we may have another +8% or so to go to achieve that 70% increase from the March low i.e. up to 1150, it could well be a slow climb from here to perhaps as late as July 2010 (11 months) with, no doubt, much volatility along the way before it is achieved.
Interestingly, the Nikkei comparison with the S&P 500, as depicted in the chart below, suggests a maximum high of 1450 by December 10th, 2010.
Stage 3 – The Top Area
Weinstein refers to this stage as the Top Area or distribution phase during which the trend loses its upward momentum and starts to trade sideways. As a market there are an equal number of buyers, who are late to the party, and sellers, who are aware that it is time to take their winnings off the table. Volume is often quite heavy and the moves, up and down, can be quite choppy as these new buyers, excited by the impression that the bull-run is still on, are met by equal measure by savvy investors who bought in at the start of the Stage 2 rise and who are now heading for the exit. The 30-week MA loses its upward momentum and starts to flatten out. And, whereas those declines in stage 2 all held above the MA, in Stage 3 the index straddles the MA, above and below it at various times.
In Morgan Stanley Europe’s research stage 3 is referred to as that of a shallow correction and their research revealed that this period lasts almost as long as the rebound rally i.e. 17 months or so.
Stage 4 – The Decline
The Decline, or downtrend stage, is a period when the factors that had sustained a rising index give way to fatigue and pressures brought about by fearful sellers and hedge fund shorting. This period shows up in the form of the trend breaking down below the bottom edge of the previous neutral trading range with the 30-week moving average turning downwards and the index moving, and staying, below it. Weinstein points out that while the conventional thinking early on is likely to be that the index is just undergoing a correction the actual correction already took place in the previous distribution phrase.
Morgan Stanley Europe makes reference to this stage as a decline in the market in which, on average, valuation drops by 59% over a period of 34 months with a median decline of 57% over 30 months.
This compares with the most recent bear market in the S&P 500 which declined 56% from its peak in October 2007 to its trough in March 2009 i.e. 17 months later. To put things in proper perspective, according to Morgan Stanley’s research, the least decline of the past 19 secular bear market was 44% over a 13 month period (in Hong Kong in 1994); the worst decline was an 86% decline over 32 months between Oct.’29 and June’32. FYI the decline in the U.S. between March’00 and Sept.’03 was 49% and the one between May’73 and March’74 was -48%. The worst in both severity of decline (-73%) and duration of correction (72 months) happened in Spain between May ’74 and May ’80.
So when will the upcoming decline in the market likely conclude according to the findings of Morgan Stanley Europe? Well, with a distribution phase (Stage 3) of 17 months, on average, followed by a down-trend phase (Stage 4) of 30 – 34 months, mean and average respectively, we might well see a bottom somewhere between June, 2014 and October, 2014.
Interestingly, according to the Nikkei comparison with the S&P 500 as discussed in my article last week and identified in the chart above we might see a low of 400 by January 3rd, 2014. Based on the average of the 8 minimum length (20.5 months) and 8 maximum length (47.5 months) corrections experienced in the past 19 secular bear markets such a bottom would occur no earlier than July, 2013 and no later than November, 2015.
It is interesting to note that, as mentioned in my article last March entitled “Dent, Prechter and Others Warn that the Worst is Yet to Come (Engulf Us)”, Russell Napier has predicted a bottom sometime in 2014(5).
While Weinstein’s analysis of market cycles does not dwell on the duration of each of the 4 stages Morgan Stanley’s does stating that, on average, such a cycle lasts approximately 11.5 - 12 years with Stage 1 being almost 6 years; Stage 2 almost 1.5 years; Stage 3 almost 1.5 years and Stage 4 almost 3 years. That being the case then the current S&P 500 cycle from top to bottom to top again may well be only 16% (i.e. 23 months) along the way.
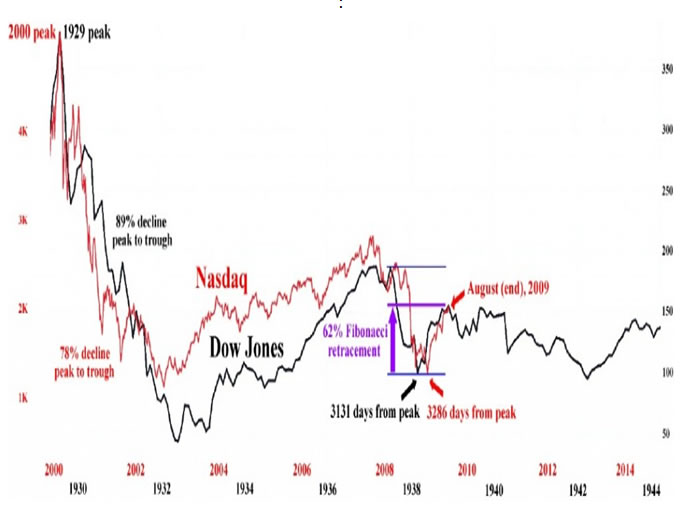
Such market cycles have been the norm over the past 80 years of Morgan Stanley’s research period. The chart below (compliments of tradersnarrative.com) shows the similarities between the recent Nasdaq bear market compared to the Dow Jones bear market of 1929 and their respective aftermaths. So far the charts are eerily similar and suggest that, just as what has been described above, we may well experience a further run-up in the Nasdaq before Stage 4 is complete and Stage 1 begins.
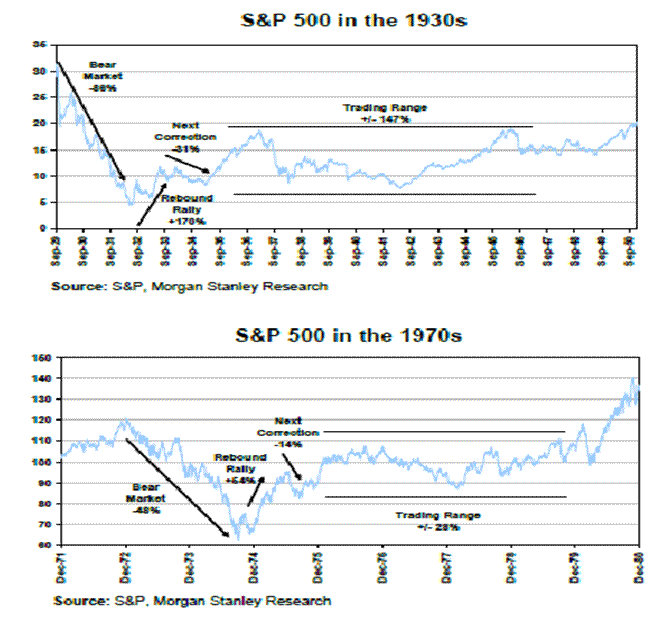
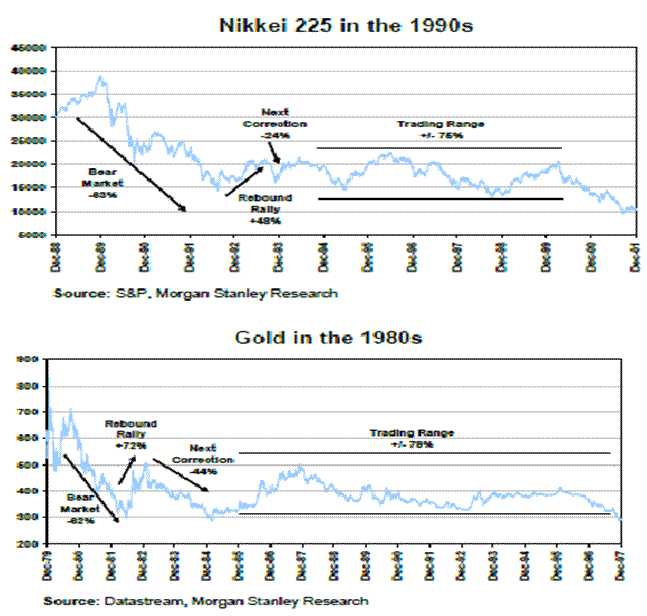
Then there is the performance of the S&P 500 in the 1930s and 1970s, gold in the 1980s and the Nikkei in the 1990s below which clearly show the 4 stages of secular bear markets:
So there you have it! Now you have an understanding of the current markets using the research and analyses of Morgan Stanley Europe, Merrill Lynch Asia, Stan Weinstein, Alan Saunders, and yours truly, to help you take charge of your investments and adopt a path to consistent trading profits in both bull and bear markets.
Sources: (1) “Stage Analysis – finding the ‘breakout’ shares” by Alan Saunders at trade2win.com (2) “The Aftermath of Secular Bear Markets” by Babak at tradersnarrative.com (3) “Sorry to Blow Your $u$$le, Ringing the Bell” by Boris Chikvashvili at borisc(at)blogspot.com, (4) ”If US is Japan, S&P Will Soar 40% Over the Next Year” by Henry Blodget at businessinsider.com and (5) “Solid Ground – Global outlook” by Russell Napier at clsa.com.
To my readers: Contact me at Lorimer@preciousmetalswarrants.com with questions and comments. I promise a reply. Don’t be shy - drop me a line or two. Guest Contributors are welcome – just send me a draft of your proposed article for consideration. That’s how I got started. It is a very enjoyable and stimulating activity. I will be speaking at the World MoneyShow in Toronto in October. If you attend please introduce yourself.
We have two web sites that we believe will help you make money in these very volatile times.
www.PreciousMetalsWarrants.com provides a free one-of-a-kind database (updated weekly) on all commodity-related warrants trading on exchanges in the United States and Canada and offers a subscription service ($19.95 or $49.95) which ranks all warrants according to their own current unique leverage/time values based on four projected stock price appreciation levels.
Thanks for the read. – Lorimer.
© 2009 Copyright Lorimer Wilson- All Rights Reserved
Disclaimer: The above is a matter of opinion provided for general information purposes only and is not intended as investment advice. Information and analysis above are derived from sources and utilising methods believed to be reliable, but we cannot accept responsibility for any losses you may incur as a result of this analysis. Individuals should consult with their personal financial advisors.
Lorimer Wilson Archive |
© 2005-2022 http://www.MarketOracle.co.uk - The Market Oracle is a FREE Daily Financial Markets Analysis & Forecasting online publication.