


Stock Market Investor Bullish Perceptions, It's Odd, But True
Stock-Markets / Stock Market Sentiment Sep 20, 2009 - 01:01 PM GMTBy: Guy_Lerner

 Market participants remain all giddy about the bullish developments of the past months. Yet, one year ago, a level of 1200 on the S&P500 had everyone in a panic, and this was before a 20% two week plunge. On Friday, with the SP500 closing at 1068, everyone is now ecstatic and most investors see nothing but blue skies ahead even though the fundamental outlook is just as muddled as 12 months ago. It's odd, but true. Two different investor outlooks but essentially the same level on the S&P500. So what has changed?
Investors' perceptions. It's where we have been (S&P500 ~666), where we have gone (S&P500 ~1068) and how fast we have gotten there (over 6 months) that investors attach significance too. It's not the fundamentals. It's not the values. It's the change in price and the hope that the market is forecasting what most of us cannot see: a robust economic recovery.
I can understand the buying at the March, 2009 lows. There was a dislocation in the markets, investors were bearish (i.e., bull signal) and great values were to be had. This was the time to be bullish. I can understand the buying back in early July, 2009. This was likely due to short covering as traders expecting and positioned for the markets to rollover threw in the towel giving the markets much needed fuel to move higher. And I can even understand the buying now. The markets are in a strong up trend.
But to attach any significance to the market's current strength is wrong. It is just the same old story of fear and greed. The difference between March and now is that the party is getting very crowded, and when the punch bowl is taken away, most investors will have a difficult time finding the exits. Anecdotal evidence would suggest this is particularly so in a market driven by notions of "liquidity"; sell offs can be rather brisk.
None of this is to suggest that I see a sell off in the near future, but from this perspective, risk is rising. As I have been stating for several months now, there is an upward bias until the extremes in bullish sentiment are unwound. Shorting the major indices beyond 1 hour seems to be a difficult notion in this market.
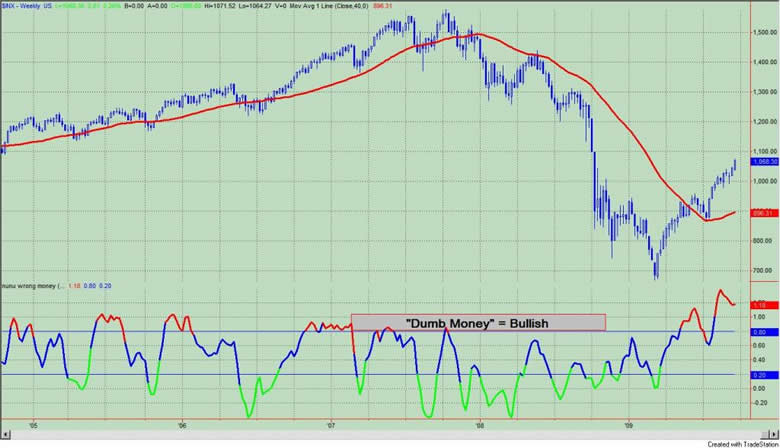
The "Dumb Money" indicator is shown in figure 1. The "Dumb Money" indicator looks for extremes in the data from 4 different groups of investors who historically have been wrong on the market: 1) Investor Intelligence; 2) Market Vane; 3) American Association of Individual Investors; and 4) the put call ratio. The "dumb money" remains extremely bullish.
Figure 1. "Dumb Money" Indicator/ weekly
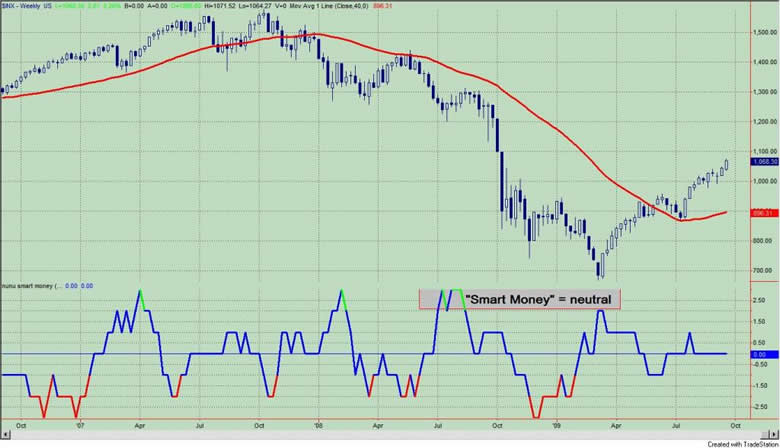
The "Smart Money" indicator is shown in figure 2. The "smart money" indicator is a composite of the following data: 1) public to specialist short ratio; 2) specialist short to total short ratio; 3) SP100 option traders. The "smart money" is neutral.
Figure 2. "Smart Money" Indicator/ weekly
Company insiders have resumed selling of their shares to an extreme degree. See figure 3, a weekly chart of the S&P500 with the Insider Score "entire market" value in the lower panel.
Figure 3. InsiderScore Entire Market/ weekly
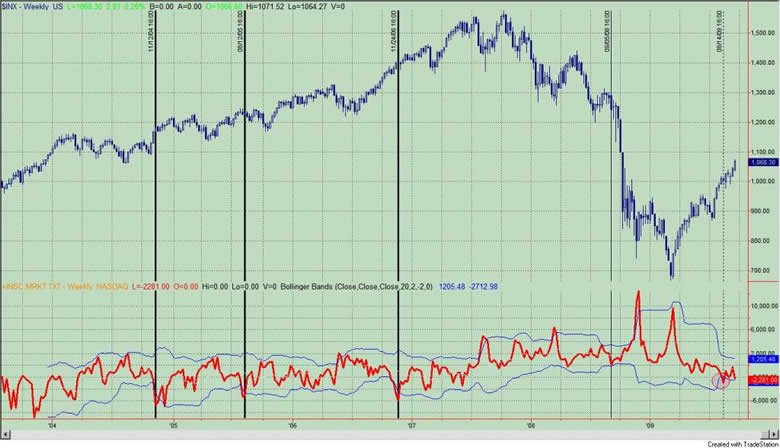
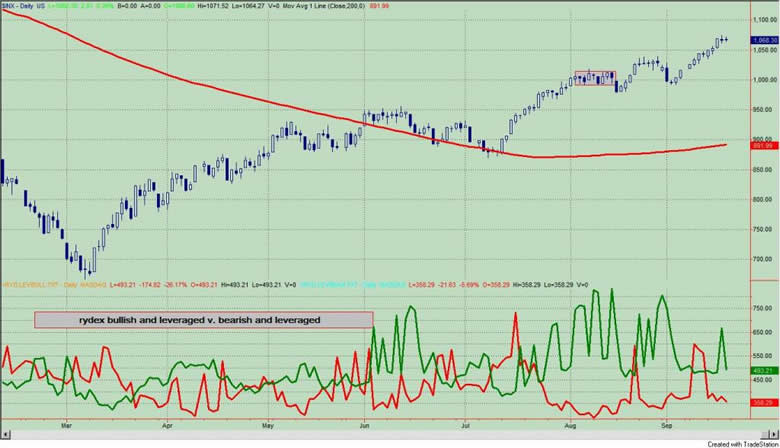
Figure 4 is a daily chart of the S&P500 with the amount of assets in the Rydex bullish and leveraged funds versus the amount of assets in the leveraged and bearish funds. Not only do we get to see what direction these market timers think the market will go, but we also get to see how much conviction (i.e., leverage) they have in their beliefs. Typically, we want to bet against the Rydex market timer even though they only represent a small sample of the overall market. As of Friday's close, the assets in the bullish and leveraged funds were greater than the bearish and leveraged; referring to figure 4, this would put the green line greater than red line.
Figure 4. Rydex Bullish and Leveraged v. Bearish and Leveraged/ daily
By Guy Lerner
http://thetechnicaltakedotcom.blogspot.com/
Guy M. Lerner, MD is the founder of ARL Advisers, LLC and managing partner of ARL Investment Partners, L.P. Dr. Lerner utilizes a research driven approach to determine those factors which lead to sustainable moves in the markets. He has developed many proprietary tools and trading models in his quest to outperform. Over the past four years, Lerner has shared his innovative approach with the readers of RealMoney.com and TheStreet.com as a featured columnist. He has been a regular guest on the Money Man Radio Show, DEX-TV, routinely published in the some of the most widely-read financial publications and has been a marquee speaker at financial seminars around the world.
© 2009 Copyright Guy Lerner - All Rights Reserved
Disclaimer: The above is a matter of opinion provided for general information purposes only and is not intended as investment advice. Information and analysis above are derived from sources and utilising methods believed to be reliable, but we cannot accept responsibility for any losses you may incur as a result of this analysis. Individuals should consult with their personal financial advisors.
Guy Lerner Archive |
© 2005-2022 http://www.MarketOracle.co.uk - The Market Oracle is a FREE Daily Financial Markets Analysis & Forecasting online publication.