Gold and U.S. Dollar Inverse Relationship Trend Implications
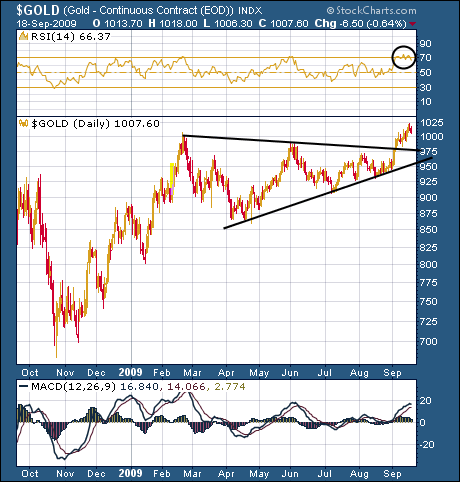
Commodities / Gold & Silver 2009 Sep 20, 2009 - 01:20 AM GMT Gold - Gold was up for the week, gaining $1.40, to close at $1007.60 (continuous contract). The daily chart shows gold still positively above its recent breakout. The trend remains in place until such time that it isn’t.
Some consolidation is warranted, and perhaps a test of the breakout. RSI is overbought and turning down. All in all the bulk of the evidence is bullish, although waning slightly.
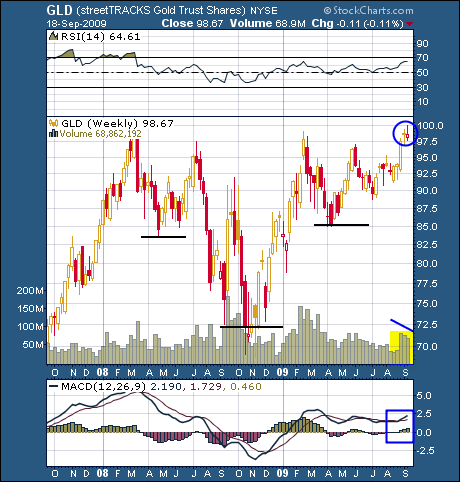
So far, gold seems to be probing the general area of overhead resistance. This week’s inverted hammer (candlestick) casts a bit of doubt on the direction of GLD. This candlestick usually foreshadows that a trend reversal MAY be at hand. It needs to be confirmed by subsequent price action. A heads up is warranted.
The weekly chart still shows the inverse head & shoulders formation intact. Price has bumped up into overhead resistance marked by the neckline of the formation. As of yet, price has not broken out on expanding volume, which is imperative. See complete details in the full market wrap for subscribers. This questions an immediate break out to new highs.
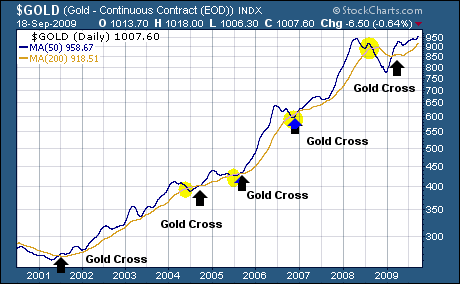
On my website this week there was a discussion about golden crosses: what they were and what they meant; so I decided to revisit the topic here.
The chart below was posted months ago, but remains relevant. It shows all of the golden crosses (50dma crosses over/above 200dma) since the inception of the bull market.
A few things to notice: we are still under a positive golden cross from earlier this year, which portends higher prices long term; after EVERY golden cross a significant move up occurred; and lastly, notice that most, but not all of the positive crosses, were preceded by a negative cross (50dma moving below 200dma). These (negative crosses) are marked by the yellow circles.
Now, for some more inter-market relationships; this time between gold and the U.S. dollar. For most of its history, gold and the dollar have moved inversely, or in opposite directions from one another.
If the dollar was up, gold would be down. If gold was up, the dollar would be down. The first chart below shows this inverse relationship intact.
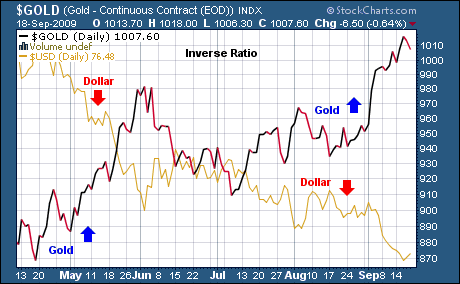
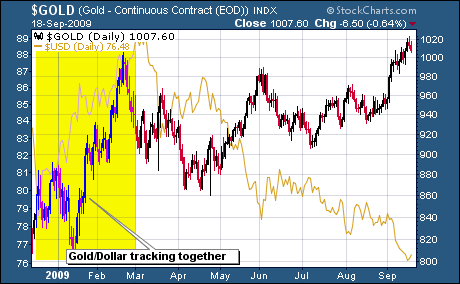
The next chart focuses in on the timeframe from the beginning of this year to about March – the price action is highlighted in yellow. During this time both the dollar and gold rose together.
This event has ended, but the question still lingers: might it happen again? I think it might, but I have no idea when. The future is not predictable.
I think it will take another scare or hit to the financial system to cause such a flight to safety, but that is just an opinion – not fact.
Once again, this is not a sign of stability or strength regarding the monetary system, but one of instability and weakness. Such is the nature of paper fiat debt-money or promises to pay.
For a free trial subscription email your request to dvg6@comcast.net. View over 30 charts covering stocks, bonds, currencies, inter-market relationships, commodities, gold and silver, and the mining stocks. The economy is examined in detail with almost a dozen charts included. Stop by and check it out.
Good luck. Good trading. Good health, and that’s a wrap.

Come visit our website: Honest Money Gold & Silver Report
New Audio-Book Now Available - Honest Money
Douglas V. Gnazzo
Honest Money Gold & Silver Report
About the author: Douglas V. Gnazzo writes for numerous websites and his work appears both here and abroad. Mr. Gnazzo is a listed scholar for the Foundation for the Advancement of Monetary Education (FAME).
Disclaimer: The contents of this article represent the opinions of Douglas V. Gnazzo. Nothing contained herein is intended as investment advice or recommendations for specific investment decisions, and you should not rely on it as such. Douglas V. Gnazzo is not a registered investment advisor. Information and analysis above are derived from sources and using methods believed to be reliable, but Douglas. V. Gnazzo cannot accept responsibility for any trading losses you may incur as a result of your reliance on this analysis and will not be held liable for the consequence of reliance upon any opinion or statement contained herein or any omission. Individuals should consult with their broker and personal financial advisors before engaging in any trading activities. Do your own due diligence regarding personal investment decisions. This article may contain information that is confidential and/or protected by law. The purpose of this article is intended to be used as an educational discussion of the issues involved. Douglas V. Gnazzo is not a lawyer or a legal scholar. Information and analysis derived from the quoted sources are believed to be reliable and are offered in good faith. Only a highly trained and certified and registered legal professional should be regarded as an authority on the issues involved; and all those seeking such an authoritative opinion should do their own due diligence and seek out the advice of a legal professional. Lastly Douglas V. Gnazzo believes that The United States of America is the greatest country on Earth, but that it can yet become greater. This article is written to help facilitate that greater becoming. God Bless America.
Douglas V. Gnazzo © 2009 All Rights Reserved
© 2005-2022 http://www.MarketOracle.co.uk - The Market Oracle is a FREE Daily Financial Markets Analysis & Forecasting online publication.


