


Stock Market Crash, Rosenberg Says this is Your Last Chance!
Stock-Markets / Financial Crash Sep 14, 2009 - 07:28 AM GMTBy: Guy_Lerner

 Over the last several months, we have been very fortunate to read the missives of Gluskin Sheff's chief economist and strategist, David Rosenberg. Aside from a stellar career at Merrill Lynch, Mr. Rosenberg gained notoriety for his early "call" on the recession that began in December, 2007. Now Mr. Rosenberg is gaining notoriety as the last bear standing. Despite a 50% run in the S&P500 and a growing chorus that the economy has turned a corner, Mr. Rosenberg has been steadfast in his resolve:
"This rally is based on a lot of hope that we are going to see a V-shaped economic recovery in the U.S. The S&P 500 is priced for 4% real GDP growth. We don’t see it."
I am empathetic towards Mr. Rosenberg as I too have had a cautionary view towards equities since mid-May. Being cautious while the market goes up day after day and not seeing what everyone else is seeing (sic) is very frustrating. But leave it to Mr. Market. One minute you are a hero for calling the recession, the next minute you are a goat for missing the recovery. The market beast can be very humbling.
But truth be told, Mr. Rosenberg could be right in the end, and I believe we are now approaching that juncture in the markets that could prove him right. In essence, this is his last chance.
In particular, there is a growing divergence between the 10 year Treasury yield, which is falling, and the equity markets, which are rising.
In "Long Term Treasury Yields: Someone Is Going To Be Wrong", which I wrote on August 26, 2009, I stated:
"the divergence between lower yields - a sign of economic weakness - and higher equity prices - a sign of economic strength - will not persist for long. Most importantly, it was the failed signal in June, 2002 that coincided with a 25% plus drop in equities over the next two months. It should be noted that the current set up in Treasury yields and likely failure is exactly the same as in 2002!"
So why is this Mr. Rosenberg's last chance? Treasury yields are falling (and likely to go lower) and during equity bull markets that is a good thing. But if we are still in a bear market, then falling Treasury yields is a bad sign for equities. And this is the first time since the March, 2009 bottom that Treasury yields are falling. So Mr. Rosenberg still has a chance of being proven right.
Let me demonstrate graphically. See figure 1 and figure 2, weekly charts comparing the S&P500 (symbol: $INX) to the yield on the 10 year Treasury (symbol: $TNX). (Treasury yield data is hidden.) When the 14 week rate of change (i.e., a simple default value) of the 10 year Treasury yield is below zero (as it is now), the price bars appear red. Blue price bars (on the S&P500 price graph) are when the 14 week rate of change on the 10 year Treasury yield is positive.
Figure 1. S&P500 v. 10 Year Treasury Yield/ weekly
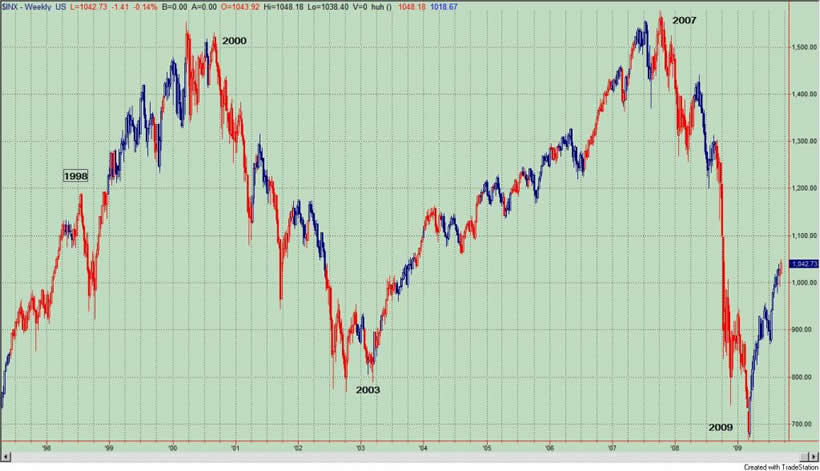
As you can see, there is a lot of red from 2000 to 2003 and from 2007 to the recent bottom in 2009. During these bear markets, lower yields translated into equity weakness. Currently, the 14 week rate of change of Treasury yields is negative, and as stated previously, this is the first time since the March bottom.
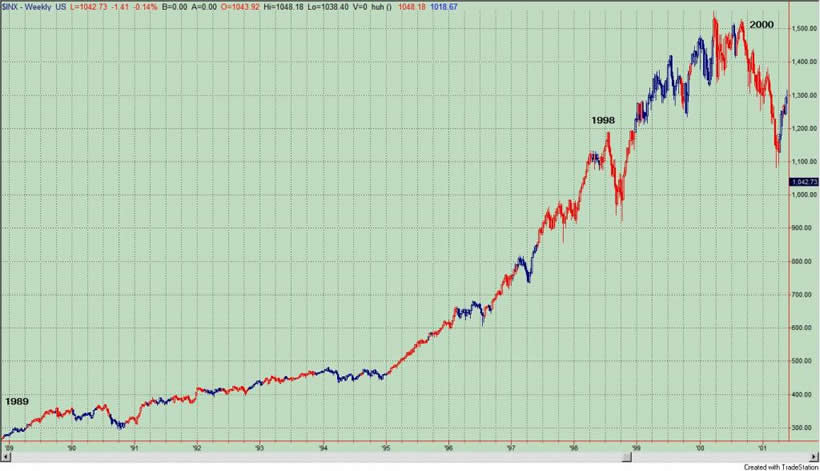
In figure 2, which is from 1988 to 2000, lower 10 year Treasury yields (red bars) always translated to higher equity prices. The lone exception was 1998. After all this was a bull market. Referring back to figure 1, lower Treasury yields were kind to equities during the bull run from 2003 to 2007.
Figure 2. S&P500 v. 10 Year Treasury Yield/ weekly
So this is it. This is where the rubber meets the road for Mr. Rosenberg. This is the first time since the March, 2009 low that the 10 year Treasury yield is heading lower (on a 14 week rate of change basis). If equities are in a new bull market as many claim, then lower yields will be a buying opportunity. Mr. Rosenberg will suffer the market's humiliation. If equities are in a bear market and the past 6 months have been nothing more than a monster bear market rally, then lower yields should spell trouble for equities. They did in 2002.
So hang in there, Mr. Rosenberg. I hope you don't throw in the towel. You could turn out to be a hero after all.
By Guy Lerner
http://thetechnicaltakedotcom.blogspot.com/
Guy M. Lerner, MD is the founder of ARL Advisers, LLC and managing partner of ARL Investment Partners, L.P. Dr. Lerner utilizes a research driven approach to determine those factors which lead to sustainable moves in the markets. He has developed many proprietary tools and trading models in his quest to outperform. Over the past four years, Lerner has shared his innovative approach with the readers of RealMoney.com and TheStreet.com as a featured columnist. He has been a regular guest on the Money Man Radio Show, DEX-TV, routinely published in the some of the most widely-read financial publications and has been a marquee speaker at financial seminars around the world.
© 2009 Copyright Guy Lerner - All Rights Reserved
Disclaimer: The above is a matter of opinion provided for general information purposes only and is not intended as investment advice. Information and analysis above are derived from sources and utilising methods believed to be reliable, but we cannot accept responsibility for any losses you may incur as a result of this analysis. Individuals should consult with their personal financial advisors.
Guy Lerner Archive |
© 2005-2022 http://www.MarketOracle.co.uk - The Market Oracle is a FREE Daily Financial Markets Analysis & Forecasting online publication.