


Economic Fundementals Suggest This Fall and Winter Could Get Ugly
Economics / Recession 2008 - 2010 Sep 11, 2009 - 02:38 AM GMTBy: ArbitraryVote

 Since March of this year, we have seen growing consensus and excitement from the mainstream media and government about an economic recovery underway. Scattered economic indicators are released and spun in a positive light when they are proportionally minuscule improvements compared to the declines already experienced for each given indicator. They typically use this sugarcoated data and ignore reality to say “the worst is behind us, yet perhaps we’ll still see a 10-15% correction in the markets, and growth might be slow for quite awhile”. In under six months from the low, the markets have rallied over 45%. Yet this type of market move up hasn’t been seen since the lead-up to the crash of October, 1987.
 It is extremely difficult to find a true bright spot in the economy that indicates improvement enough to warrant such optimism. To begin, here is a brief update about the 4 key underlying economic problems outlined within Arbitrary Vote’s original warning article:
- Unprecedented, massive amounts of existing and coming national debt – U.S. national debt has continued to increase and there is no sign of future debt letting up.
- Foreign reluctance to fund U.S. debt – China, Russia, Brazil, etc continue to back away from U.S. Treasurys, diversify into other investments, and make moves toward trade in non-U.S. currency.
- Declining productivity and indicators of poor future productivity – GDP has continued to fall and unemployment has continued to rise. Recent political action, reform currently on the table, and mounting taxation all point to future productivity damage.
- Unprecedented, massive levels of money printing – The printing presses have been running non-stop and there’s no real sign of them letting up. Much of the recovery hype has stemmed from economic illusions caused by this temporary “fix”.
All of these factors have continued and mostly worsened since June. Each plays as significant a role as ever in the near- and long-term direction of the economy.
The situation is worse than described by most mainstream sources, and because of developments thus far this year and events unfolding in the near future, there are particular reasons to beware of the months ahead. A few communication sources are predicting stock market crashes and corrections for the autumn of 2009, but rarely outline specifically what could be so dangerous about this timing and potential big-picture implications.
A large segment of this analysis is devoted to outlining the near-term factors that could cause serious economic and societal problems in the coming months. The outline of factors is broken down as follows:
- Current activities and conditions - Those activities and economic conditions that continue to be underway and could lead to additional economic problems in the near-term.
- Scheduled near-term activities - Those activities that are scheduled to take place within this autumn or winter and could lead to economic harm.
- Uncertain near-term activities - Those activities that could happen within this autumn or winter and could lead to economic harm.
After walking through the statistics and information under each of these three sections, everything will be tied together to depict the overall impact on the economy.
Current Activities and Conditions
The following is an outline of activities and economic conditions that continue to be underway and could lead to additional economic problems in the near-term.
Commercial real-estate
Many predict commercial real-estate to be the "next shoe to drop" in the economic crisis. We are certainly seeing early signs that this is correct, and there is a lot more to come.
- Commercial real-estate mortgage maturities begin to ramp up in the 4th quarter of 2009. There is an estimated $400 billion of commercial real-estate exposure for this year.
- So far this year, there have been defaults, foreclosure or bankruptcy on $83 billion of office, retail, industrial and apartment properties. This number is expected to double by the end of 2009. Lenders have foreclosed on less than 10 percent of defaulted loans.
- The Commercial Mortgage Backed Securities (CMBS) sector's delinquency rate was 3.14% in July, more than six times the level a year earlier.
- Banks hold $1.7 trillion of commercial mortgages and construction loans (different from CMBS). Delinquencies on this debt already have contributed to the rise in bank failures this year.
- Most of the $6.7 trillion in commercial real estate is privately owned
- Anecdotally, you can probably look around your neighborhood shopping centers, strips, and malls and observe the difference in vacancy within recent months and over the past year.
Residential real-estate
The subprime mortgage crash ignited the economic crisis. We are now faced with another residential real-estate crisis just beginning to ramp up.
- The first significant wave of Alt-A and Option Adjustable Rate Mortgage (Option ARM) resets are beginning, and there is $1.1 trillion to $2.6 trillion in estimated exposure over the next couple of years. Exposure between these mortgage types and prime mortgages is likely to be at least in the tens of billions over the next six months.
- As of August 20th, 13% of homeowners with a mortgage have fallen behind on their payments or are in foreclosure.
- The portion of delinquent loans that return to current payment status each month (i.e. the “cure rate”) is down to 4.3% from a 30.2% historical average for Alt-A, 6.6% from a 45% historical average for prime, and 5.3% from a 19.4% historical average for subprime mortgages.
- California’s 90-day mortgage foreclosure moratorium expires in the middle of this September. This will add to the rising tally of foreclosures.
Banking industry
Both commercial and residential real-estate problems will continue to build pressure on the banking industry, which is already quite unhealthy.
- As of June 30th, there were 416 troubled banks (up from 305 in Q1) on the FDIC’s list; Assets at troubled banks totaled $299.8 billion
- As of August 24th, banking analyst Richard Bove predicted 150-200 more bank failures
- As of August 21st, banking analyst Meredith Whitney predicted over 300 more bank failures
- As of September 4th, a total of 89 banks had failed in 2009
- The FDIC reports that more than 1 in 4 banking institutions are unprofitable
- More than 150 publicly traded U.S. lenders own nonperforming loans that equal 5 percent or more of their holdings, a level that former regulators say can wipe out a bank’s equity and threaten its survival.
- Large banks are under-capitalized unlike what the government has communicated:
- Bank of America – Loan value was $64.4 billion less than their balance sheet indicated (58% of the bank’s Tier 1 common equity) as of June 30th
- Wells Fargo – Loan value was $34.3 billion less than their balance sheet indicated (73% of the bank’s Tier 1 common equity) as of June 30th
- More foreclosures will likely surface now that the Making Home Affordable programs are fully underway and all available options for modifications and other solutions are exhausted.
As banks become more stressed because of growing problems in residential and commercial real-estate, bank lending will become more restrained, but more importantly, bank failures will become more likely. Depending on the size of the bank, the government will either offer a bailout, nationalize the bank, or a combination of the two. Both do harm to the economy beyond what would occur by allowing them to fail.
The next topic is about the state of the FDIC, which covers the government's potential route to bank bailouts more clearly.
Federal Deposit Insurance Corporation (FDIC)
Government money is provided to replenish failed banks’ balance sheets and/or facilitate acquisitions of these banks by healthier banks. Historically, the FDIC is the vehicle to do this, although the government has recently used other means in addition to the FDIC.
The FDIC is an organization that was created to give citizens the comfort that their bank deposits are safe and fully backed by the U.S. government.
Here is the current state of the FDIC:
- The FDIC's fund has dropped to 0.22 percent of insured deposits, below a Congressionally mandated minimum of 1.15 percent.
- Falling from $45.2 billion in the second quarter of 2008 and $13 billion at the end of March 2009, the fund is now at $10.4 billion.
- Excluding the stress-test list, banks with non-performers above 5 percent had combined deposits of $193 billion, according to Bloomberg data. That is now almost 19 times the size of the FDIC’s deposit insurance fund.
- Assets of the FDIC’s list of 416 troubled banks total 29 times the size of the fund.
- 1% of all money deposited under $250k (i.e. the FDIC insured level) totals $700 billion
- The FDIC has a credit line with the U.S. Treasury of up to $500 billion if needed. This money, and anything needed beyond it, is obviously printed.
State budgets
States pay the paychecks of their government’s employees, supply many vendors with contracted business, and fund many programs that offer welfare and support to their citizens. Stress in state governments’ budgets is stress on states’ economies.
- State tax revenues had declined almost 12% in the first 3 months of 2009. This is the largest decline in the 46 years the data has been collected by the Nelson A. Rockefeller Institute of Government.
- According to the Center on Budget and Policy Priorities, 48 states addressed or were facing budget deficits totaling $166 billion as of July 2009.
- There are 28 states that have had budget shortfalls greater than $1 billion just before or since their most recent budget was adopted.
- As of the end of this past July:
- 23 states have a budget gap over 0% and under 10% of the state’s general fund
- 14 states have a budget gap between 10% to 15% of the state’s general fund
- 7 states have a budget gap greater than 15% of the state’s general fund
- Because of budget shortfalls, some form of government shutdown is occurring in many states including California, Michigan, Rhode Island, Maine, Maryland, Wisconsin, Colorado, Alabama, Georgia, Arizona, etc.
- It is likely that California will revisit their budget woes in the near future. The state’s government has continuously made poor judgments on expected revenue and expenditures. Continued budget problems and current and future cuts will stress the state’s economy as fewer state vendors will get paid, layoffs and furloughs will stress citizens, and businesses will flee the state due to tax hikes and poor economic climate compared to other parts of the U.S. and world. One recent significant example is Toyota closing a major CA factory to move elsewhere.
Also, in late September, California will begin selling $10.5 billion of revenue anticipation notes (RANs) to mature in the spring. The expectation is that investors will gobble up these notes because of their competitive return. It may be worth observing the actual results. California is the 9th largest economy in the world and makes up 13% of U.S. GDP.
Retail and automotives
The retail and automotive sectors are vital to the U.S. economy. Below are recent statistics and information about both industries.
- Sales at privately held retailers fell 3.63 percent on average for the first seven months of 2009
- Publicly traded retailers' sales fell at 1.34 percent on average for the first seven months of 2009
- U.S. Census Bureau calculated retail and food services sales are down 8.3% from July of 2008. Sales were down 0.1% in July alone and that includes the boost of sales from the Cash for Clunkers program.
- Thompson Reuters reported a 5.1% July drop in retail sales based on a survey of 30 major retail chains.
- Retail professionals are predicting the worst back-to-school season in a decade. Back-to-school season is the second largest retail season of the year behind Christmas.
- Citigroup analysts estimate same-store August to September sales to fall 3-4%.
- As a recent indicator of back-to-school sales potential, chain store sales were down 0.5% for the August 29 week according to ICSC-Goldman reporting.
- The Michigan consumer sentiment poll continues to decline and is at its lowest level since March. The conference board consumer confidence index shows confidence as slightly up, but had little improvement in an already low measurement of income expectations, which likely translates to light spending due to uncertainty.
- Major short-term retail financier, CIT Group, has closely avoided bankruptcy and is likely to continue to struggle with liquidity issues as more of their lent debt is due to mature next year. Retailers will have difficulty funding inventory and other operations through borrowing as CIT and others in the space are feeling stress. This can be exacerbated during the holiday retail season.
- Of the top 10 most sold car brands through the recent Cash for Clunkers program, two were American car brands.
- Auto sales for August will likely come in quite high, but will likely see a strong drop-off shortly thereafter as Cash for Clunkers was the short-term cause of the spike.
Slower near-term sales within the retail and automotive sectors can cause additional bankruptcies in already pained industries. Another important sector to keep an eye on is the airline industry. Although, the breaking point for many airlines is projected to be more around the spring of 2010.
Unemployment
Unemployment continues to rise and plague consumers. The unemployment situation is actually worse than that openly described by the mainstream media and government.
- The official Bureau of Labor Statistics (BLS) unemployment rate (U-3) is 9.7%, the highest rate in 26 years.
- The BLS U-6 measure has unemployment at 16.8%. This measure includes those who have given up looking for work, marginally attached workers, and those employed part-time for economic reasons.
- The Shadow Government Statistics organization uses U-6 plus an estimate of those who have not looked for work in over a year (defined away during the Clinton administration) to calculate a current unemployment rate of 20.6% (using July as latest data).
- There are now 19 metropolitan areas with U-3 unemployment above 15%, the highest of which is El Centro, California with 30.2% unemployment.
- Personal income is down approximately 11.5% since its peak in 2006 and 8.5% since the beginning of the recession. Hours worked has fallen at a 7.6% annualized pace for the last six quarters and a 9% pace since the first quarter of this year. Statistics like these act as additional hidden unemployment.
- New jobless claims are still at 550k+ levels each week. The continuing claims tally recently rose to 6.23 million. The key reason for recent occasional dips in continuing claims is because of the number of people falling off of the government’s standard 26-week benefits period and onto extended benefits, which are not classified as continuing claims.
- The National Employment Law Project estimates that 540,000 Americans will exhaust their unemployment insurance benefits by the end of this September, and 1.5 million will run out of coverage by year end.
- This fallcongress is likely to pass a bill aimed at offering various unemployment insurance extensions through 2010. This would still leave large numbers of people with extremely low, if any, income or ability to make purchases. Additionally, the money to cover such extended programs will be coming from the federal government, which means more printing.
Confidence
Confidence is an extremely important factor in maintaining political and economic stability. Current trends are pointing to a broad decline in confidence.
- As we move into the autumn and winter months, there is risk of a dire realization by Americans. People may begin to see that despite a few sugarcoated government statistics, the build-up of bad statistics and painful firsthand experiences will reveal that things are not actually getting better, government measures are not working, and the printing of anymore money for bailouts will only cause further harm to the economy. This realization and resulting loss of confidence among consumers and business is a key factor in decisions around investing in U.S. stock markets and the U.S. dollar.
- President Obama’s job approval ratings have been declining at one of the fastest paces of any American president at this point into their presidency. In additional to the trend toward a crossover to the downside of approval and disapproval averages among polls, one of the historically most accurate polls (i.e. Rassmusen) shows that the crossover has already taken place. A continued decline in confidence in the president reflects declining confidence in the government and economy.
- During Congress’ recess (through Labor Day) there have been many intense town hall meetings and mounting protests around health care reform, taxes, and the government’s general policy direction. It is apparent that people are growing upset with state of the country and government.
Foreign diversification
Foreign movement away from dependence on the U.S. dollar and economy continues.
- Instances of cross-border trade historically transacted using the U.S. dollar are recently being conducted through other currencies.
- China and Hong Kong covered more than half of the increase in U.S. Treasurys sold to the public in 2006. In 2008, they covered 22%, and in the first half of 2009 the figure is down to 9%.
- As of September 2nd, China had signed an agreement to purchase $50 billion of International Monetary Fund (IMF) issued notes. This is the first time a purchase like this has been made. This type of note has recently been promoted by China as an eventual replacement for the U.S. dollar.
- Recently a top China banker called for sales of bonds denominated in Yuan rather than U.S. dollars. A move to sell U.S. bonds denominated in other countries' currencies where the U.S. has a trade deficit would currently require the printing of money, which would result in the devaluation of the U.S. dollar.
- In August, Japan’s election was won by the Democratic Party of Japan, which is the opposition to the party that has held office for the last 54 years. In May, the Democratic Party of Japan stated that if elected they would continue to buy U.S. bonds only if they were denominated in Yen.
Scheduled Near-term Activities
The following is an outline of activities that are scheduled to take place within this autumn or winter and could lead to economic harm.
U.S. fiscal year-end
The U.S. fiscal year ends on September 30, 2009. This timing could have significance in a couple of ways:
- The U.S. government financial statement for fiscal 2009 is due to be released in December. The government's previous estimates and public’s expectations compared to actual results of the financial state of the country could have significant impact on confidence domestically and internationally.
- Treasury Auctions in July totaled $725 billion. Auctions in August totaled $782 billion. September is likely to be another heavy auction month. The performance of Treasury auctions during the autumn should be closely watched as the U.S. rolls over debt, adds new debt, and moves into a new fiscal year’s budget.
Expiration of Fed programs
The Fed’s $1.75 trillion quantitative easing (QE) programs expire this October and December. Up to $300 billion in Treasury purchases expire by the end of October. Up to $200 billion of agency purchases and up to $1.25 trillion of mortgage back security agency purchases will expire at the end of December 2009. The expiration of these programs could be a double-edged sword. On one side, allowing them to expire could cause interest rates to move up significantly and propped asset classes to fall. Extending these programs, or increasing their dollar values and extending them, would send a damaging message that the economy is still in bad shape while adding to future inflation risk.
New regulation
There are a few significant pieces of legislation moving through to vote this fall, all of which can have an impact on the economy.
- The Obama administration’s push for dramatic health care reform is expected to culminate in a vote on October 15th. Health care makes up about 17% of U.S. GDP. Significant levels of business activity have been slowed or halted due to the uncertainty of health care direction in the country. Also, depending on how quickly the ensuing changes would occur, the economic impact from poor change decisions and inefficient implementation could be harmful in the following months after passing.
- Ron Paul’s Fed audit bill is to be incorporated into broader financial legislation expected to pass in October. Depending on how accurately the bill matches Ron Paul’s original intentions, the opening of Fed books could reveal information of significant concern to domestic and international investors.
- Treasury Secretary Tim Geithner recently requested that Congress increase the federal debt ceiling. He said that the country is likely to reach its debt limit as soon as mid-October. This is not likely to be a big issue to get through Congress, but if it becomes an issue in the public eye at a time when the perception of a growing debt-load is quite negative, investor confidence could be harmed.
Iran deadline
Depending on Iran's response, the September deadline for them to respond to demands of halting its nuclear program could ignite domestic and international tensions contributing negatively to the economy.
Uncertain Near-term Activities
The following is an outline of activities that could happen within this autumn or winter and could lead to economic harm.
Oil price pressure
The price of oil has pushed $75 a barrel fluctuating between $60 and $75. If it breaks above $80, the resulting increase in gas prices could have considerable impact on consumers' and business's wallets
- Production is falling in Mexico, the U.S.’s third largest supplier. Pemex’s (Mexico’s national oil company) output fell 7.1% in July, the fastest drop since 1942. Yields from Mexico’s largest oil field, Cantarell, have been dropping by annualized rates of more than 35% in recent months.
- As of June, Saudi Arabia, the U.S.’s second largest supplier, cut its oil production by nearly 16% from less than a year earlier.
- The count of U.S. oil rigs has fallen from above 2000 this time last year to below 1000. While oil production in the U.S. is recently up, demand is rising again as well.
- Oil imports to China jumped 18% from July to August and China car sales rose 48% in June from a year earlier.
All of these factors put pressure on the price of oil and are reasons for economic concern in the coming months.
Interest rate pressure
The interest rate on the 10-year Treasury bond hit nearly 4% and has been fluctuating between 3.3% and 4% since late May. A strong move past 4% will cause additional stress on home purchasers and mortgage companies. Further upward movement can cause stress for many other sectors of the economy. A spike of 50 basis points or so in a single day could cause panic among foreign and domestic investors.
Factors influencing interest rates in the near-term are:
- Massive levels of U.S. debt that continues to rise
- Foreign diversification out of U.S. Treasurys
- Expiration of Fed quantitative easing programs
- Potential fading confidence in U.S. Treasurys
Food price pressure
Weather problems (mostly droughts) last year and this year in major agricultural centers across the globe are straining crops and their output. A few examples of trouble with food supplies are:
- California – (#1 in U.S. in crop production) Due to drought, government water restrictions, and low demand from the crisis, 260,000 of the 600,000 acres that normally grow tomatoes, lettuce and other crops have been removed from production this year.
- Texas – (#2 in U.S. in crop production) A severe drought in Texas has resulted in $3.6 billion of crop and livestock losses since November of ’08. As of August of 2009, estimates say losses could surpass $4 billion by year-end.
- India – A weak monsoon has caused a rain shortfall of 8% and an expected shortfall of 15% for the quarter ending in September. About 60% of India’s crop land is dependent on rain water as opposed to irrigation. Food grain shortages are expected in 2010.
- China – As of August, a severe drought in China has affected 11.3 million hectares of grain crops making up 30% of China’s autumngrain output.
- Sugar - Raw sugar prices have risen the most in 28 years because of production shortfalls in Brazil and India. Large U.S. food companies have been warning that the U.S. could run out of sugar given the administration’s current import restrictions and rising sugar prices.
- Soybeans – The U.S. got a late start to soybean planting this summer and pod-setting is behind average by 7% (14-22% behind in key areas). The U.S. soybean stockpile is at a 32-year low and China has increased its soybean purchases by 70% in the last year. Farmers are dreading the possibility of an early frost that would kill off significant portions of the harvest.
- Wheat fungus – The Ug99 fungus poses a major threat to world wheat crops. It is estimated that up to 80% of world wheat crops could be destroyed from this fungus and 19% (in Asia and Africa) are in imminent danger.
All of these existing problems and potential threats increase commodity prices and thus the price of food for the consumer.
U.S. stock markets pressure
The U.S. stock markets can impact consumers' financial positions and confidence. Stock market performance can also directly affect businesses.
- As of the latest compiled data, the trailing 12-month PE ratio for the S&P 500 is 129.19. As of the end of August, the S&P 500 index’s PE ratio based on the average inflation-adjusted earnings over the last 10 years (different from trailing PE, which is over the last 12 months) is 17.67. This is compared to a stock market average of 16.3 over the past 140 years according to a stock market database by Yale University’s Robert Shiller. Either method of calculating PE ratios indicates that the stock market is significantly overvalued.
- Recent futures prices indicated that the VIX, a gauge of expected stock swings, is likely to increase significantly in the next several weeks. This indicates potential strong moves in the market one way or the other. Given the market’s overvalued status, a move down is the likely direction.
- Since the Dow Jones was created 115 years ago, the month of September has returned an average of -1.2%, making it the worst performing month of the year with no other month coming close. During September, the S&P 500 has returned an average of -1.3% since 1929 and it is the only month to fall 50% of the time. There are several studies and theories that try to explain the reason for this phenomenon; however, there is no proof of a cause. Nonetheless, the long-term historical data speaks for itself and offers reason for caution moving into the autumn.
- Sales of company stock by company insiders has risen to 30.6 times the level of insider stock purchases, the highest level since TrimTabs began tracking the data in 2004. This could signal that the management of many businesses believe the stock market and their own stock prices are overvalued.
- The Baltic Dry Index (BDI) has declined 44% over the last 3 months and 31% in the last month. The BDI, based on worldwide shipping prices of raw materials, is closely traced by the Dow Jones and FTSE 100 with the two indexes time-lagging behind the BDI - In other words, the BDI points to an approaching decline in stock markets.
China credit bubble
Many report that there is a credit bubble forming in China from a $1.1 trillion (i.e. about 25% of the country’s GDP) increase in lending in the first half of 2009 to compensate for their dramatic decline in export demand. Commercial and residential real-estate in China is currently overvalued, and manufacturing has over-expanded given the real lack of demand. A bursting of this bubble would cause economic waves across the globe.
Swine flu
A top presidential panel is estimating that this autumn the swine flu could infect 30-50% of the U.S. population. The panel projects 30,000 to 90,000 deaths and up to 1.8 million hospital visits. The government has been flat wrong about statistics like these in the past; however, if we even approach the low end of these levels, the economic impact will be quite harmful.
- Hospital resources will be strained by a spike in demand and recently downsized capacity
- State and local budgets will be strained
- People that are infected will be less likely to work or shop during the time they are infected
- Many that are not sick will be less likely to participate in economic activity away from home (e.g. shopping, dining out, etc) for fear of getting sick
Natural disaster
Natural disasters are unknown events that can negatively impact an economy, especially when the economy is already in a fragile state. Hurricane season peaks in September and ends on November 30th. Florida is one example of a state where the economic impact (e.g. insurance costs, tourism, etc.) of a single destructive hurricane would be quite devastating given the timing. California’s continued drought causes economic problems directly, but also indirectly through offering a productive environment for massive forest fires.
Resulting Economic Impact
All of the factors described to this point have developed throughout this year or are developing this fall and winter. Each factor alone is reason for concern. However, they all interlink throughout the economy to put us in a questionable and potentially dangerous situation for the near-term. Below is a diagram to depict the relationships between the aforementioned problems we face and their impact on stock markets, the value of the dollar, and ultimately, you. Each issue described above fits in one way or another into at least one of the blue boxes within this diagram.
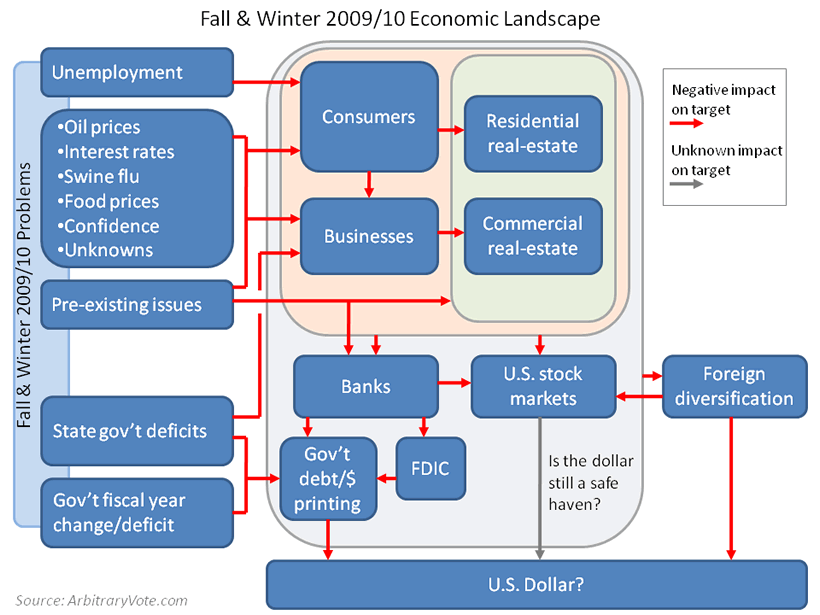
The boxes stacked on the left side of the diagram are the problems we have been facing or will likely face within the coming months. The arrows show what areas of the economy these problems will negatively impact. The degree of negative impact is assumed uncertain. You may notice relationships that are not indicated on the diagram, such as the negative impact of struggling business on unemployment; however, this type of impact is assumed given that unemployment is listed as a growing problem we face in the near future.
“Pre-existing issues” are those issues which have already transpired over the last couple of years that have made the economy vulnerable and continue to cause trouble. A few examples are: businesses continue to deal with poor borrowing conditions and inventory problems, consumers are struggling with unemployment and personal debt, both are getting hammered by added taxation, and residential and commercial real estate are still marred by rising defaults and lending problems. "Unknowns" are negative economic results from scheduled or uncertain near-term activities, such as what might happen if the Iran deadline causes international tension or if the supposed China credit bubble bursts.
To sum it up in a nutshell, the problems we face this fall and winter could translate into problems with your stock investments, employment security, pension, fixed income investments, and potentially every U.S. dollar you possess.
Impact on the Dollar
A major question to ask (indicated by the only gray arrow on the diagram) when thinking about the consequences of these economic activities is, how will the dollar fare if there is another panicked leg down in the markets? While money printing and foreign diversification will continue to impact the dollar negatively, a perception that the dollar is still a safe-haven could help it weather another powerful market drop.
During the crisis panic last fall, there was a flight to safety with strong investment in U.S. Treasurys and the U.S. dollar. What will be the reaction the next time around? Are people still confident in U.S. debt after seeing the massive budget deficit on the year coupled with White House projections of $9 trillion in deficits (with a likelihood of being higher) to come over the next 10 years - and especially given the nearly $11.8 trillion of existing debt and the many tens of trillions in debt already anticipated from Social Security and Medicare?
There are arguments circulating the web that as we reduce our trade deficit, the need for foreign U.S. Treasury purchases will diminish as it will be absorbed by America's purchases. Can this be something that we can rely on? Aside from federal intragovernmental holdings and Fed interventions, it is difficult to envision capable and willing buyers in America. Some of the largest groups of American purchasers simply can't afford it. For example, state and local governments have their own deficit and debt problems, public and private pension funds are about to collapse, and what individual American or business would want to put their money into a “safe" debt investment that they know will be severely deluded in value at its point of maturity? With a dramatically growing Treasury supply and stagnating or declining purchase capacity from American purchasers, relying on our own country to bail us out is not a safe bet.
Additionally, while in the short-term it is advantageous for foreign holders of U.S. debt to stay invested, they continue to gradually diversify out of this position to minimize their vulnerability. A dramatic move to dump the dollar at some point will likely be less harmful to them than it once was, especially considering the harm that would be caused by remaining a holder.
A related continuing argument circulating the web and mainstream is the question of inflation or deflation. We may still be going through a powerful period of deflation given the level of debt contraction still unfolding. That does not mean that the money supply cannot rise while many prices fall. This occurred in Weimar Germany during their hyperinflation. It also does not mean that critical resources (e.g. energy and food) cannot rise in price and cause additional economic harm.
Also, just because price inflation has not spiked yet, doesn’t mean it won’t. The economy and dollar are both fragile and vulnerable, and the Fed continues to have an inflationary policy mindset. It is also possible that a significant move up in price inflation could still be a ways down the road - perhaps several years. Nonetheless, deflation can precede hyperinflation.
With no guaranteed answer for timing and magnitude of either economic direction, why not be prepared for both? In such a time of uncertainty, one can hopefully diversify investments to hedge and gradually make adjustments as new information reveals reality. As for the social consequences of a given economic path considering the circumstances, the eventual result is pain. Being mentally and physically ready for a potential economic collapse is key to surviving it. Read suggestions about preparation as well as a discussion of the broader economic outlook in Arbitrary Vote’s original warning article, but also take the initiative to do an analysis yourself.
Over the coming fall and winter months, we face many significant threats to an already vulnerable economy. The chances are quite high for another considerable dip in the stock markets due to negative economic forces. If another big drop occurs, there is a reasonable chance that a dramatic move out of the dollar could be made and one of the harmful scenarios outlined in the main Arbitrary Vote warning article could come to fruition. My hunch is that for one more round, the dollar will again be viewed as a safe-haven and a collapse larger than the magnitude we saw in the autumn of ’08 will be pushed out awhile longer. However, the conditions are fragile and critical enough to keep a serious watch and be prepared for the worst.
Arbitrary Vote is not attempting to make an economic prediction, but instead wishes to arm you with information so that you may make your own judgments and preparations for the future. View a list of many of the sources used for this article, and monitor events of the approaching fall and winter months.
The U.S. is the most prosperous nation on earth. Prosperity has led to the comfort of its citizens. Mainstream media and government have long been the predominant channels for educating the broad public on affairs that directly affect their lives. What they communicate is generally what is believed and accepted.
Arbitrary Vote aims to provide to its readers an alert about the direct and underlying causes of America's economic troubles while elucidating the consequences of leaving the country's current direction unchanged. Few of the concepts within this website are new, but are seldom heard by the broad public. While the presentation of concepts is simple, the website allows readers to dig deeper toward background facts and theory that elaborate on simplified statements. Additionally, the community nature of the website enables interaction and debate around the issues, which certainly can influence the core website content.
© 2009 Copyright Arbitrary Vote - All Rights Reserved
Disclaimer: The above is a matter of opinion provided for general information purposes only and is not intended as investment advice. Information and analysis above are derived from sources and utilising methods believed to be reliable, but we cannot accept responsibility for any losses you may incur as a result of this analysis. Individuals should consult with their personal financial advisors.
© 2005-2022 http://www.MarketOracle.co.uk - The Market Oracle is a FREE Daily Financial Markets Analysis & Forecasting online publication.