


Stock Market Top Requiring Time to Develop
Stock-Markets / Stock Index Trading Sep 07, 2009 - 12:46 AM GMTBy: Guy_Lerner

 If a market top is developing, it will take several weeks to do so as the bullish extremes of the last several months need to be unwound. I have been stating the following for several weeks now: 1) the greatest gains are behind us; 2) the markets are to trade in a range with an upward bias; 3) there will be a bid under the market; 4) it will be tough to short or bet against this market for the foreseeable future.
When I first wrote those words on August 8, 2009, the S&P500 was at 1010.48; on Friday, the S&P500 closed at 1016.40. For the last 4 weeks, the S&P500 has been in a 60 point range. There is little follow through on either side of the equity markets. Outsize bets in either direction are not warranted. However, sector bets may still prove fruitful with commodity based sectors and ETF's outperforming.
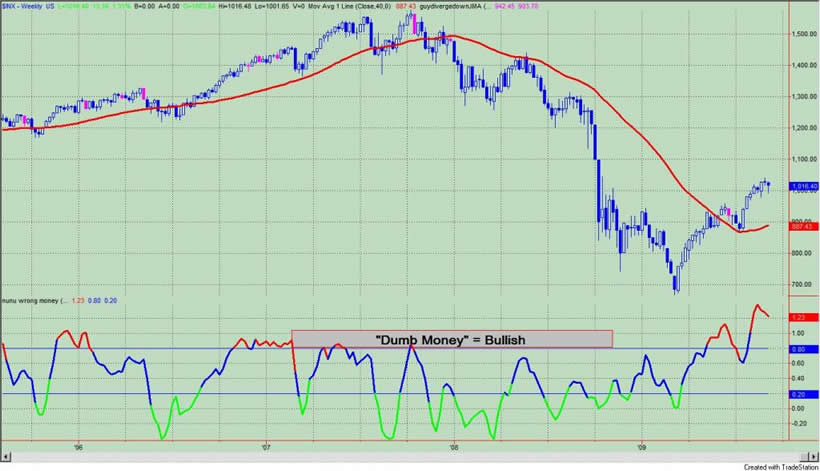
The "Dumb Money" indicator is shown in figure 1. The "Dumb Money" indicator looks for extremes in the data from 4 different groups of investors who historically have been wrong on the market: 1) Investor Intelligence; 2) Market Vane; 3) American Association of Individual Investors; and 4) the put call ratio. The "dumb money" remains extremely bullish.
Figure 1. "Dumb Money" Indicator/ weekly
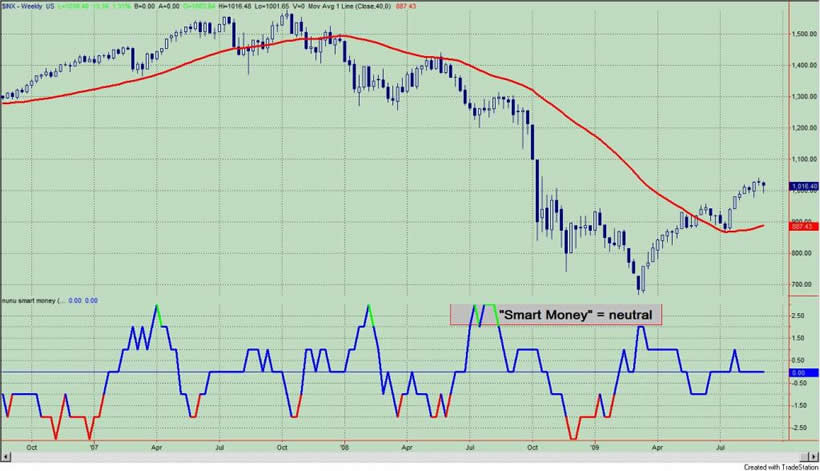
The "Smart Money" indicator is shown in figure 2. The "smart money" indicator is a composite of the following data: 1) public to specialist short ratio; 2) specialist short to total short ratio; 3) SP100 option traders. The "smart money" is neutral.
Figure 2. "Smart Money" Indicator/ weekly
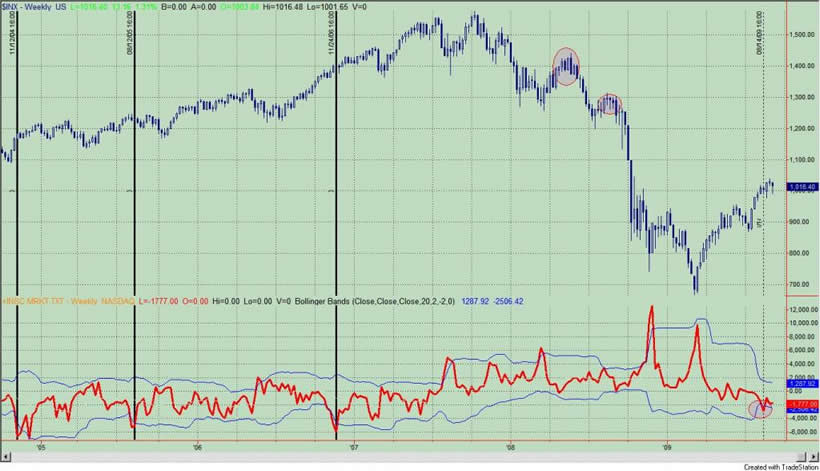
Company insiders continue to sell their shares to an extreme degree. See figure 3, a weekly chart of the S&P500 with the Insider Score "entire market" value in the lower panel.
Figure 3. Insider Buying v. Selling/ "Entire Market"/weekly
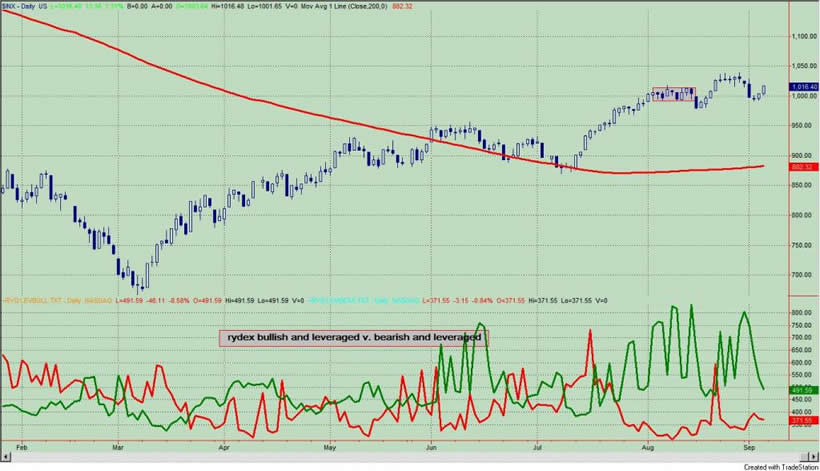
Our last look at investor sentiment comes from the Rydex bullish and leveraged (green) v. the Rydex bearish and leveraged (red) assets. See figure 4 a daily chart of the S&P500. After starting the week very bullish, these market timers threw in the tool as the market moved lower. Of course, if they had stayed only a few more days, Friday's lift would have bailed them out.
Figure 4. Rydex Bullish and Leveraged v. Rydex Bearish and Leveraged/ daily
By Guy Lerner
http://thetechnicaltakedotcom.blogspot.com/
Guy M. Lerner, MD is the founder of ARL Advisers, LLC and managing partner of ARL Investment Partners, L.P. Dr. Lerner utilizes a research driven approach to determine those factors which lead to sustainable moves in the markets. He has developed many proprietary tools and trading models in his quest to outperform. Over the past four years, Lerner has shared his innovative approach with the readers of RealMoney.com and TheStreet.com as a featured columnist. He has been a regular guest on the Money Man Radio Show, DEX-TV, routinely published in the some of the most widely-read financial publications and has been a marquee speaker at financial seminars around the world.
© 2009 Copyright Guy Lerner - All Rights Reserved
Disclaimer: The above is a matter of opinion provided for general information purposes only and is not intended as investment advice. Information and analysis above are derived from sources and utilising methods believed to be reliable, but we cannot accept responsibility for any losses you may incur as a result of this analysis. Individuals should consult with their personal financial advisors.
Guy Lerner Archive |
© 2005-2022 http://www.MarketOracle.co.uk - The Market Oracle is a FREE Daily Financial Markets Analysis & Forecasting online publication.