


Gold, Precious Metals Real or False Breakout?
Commodities / Gold & Silver 2009 Sep 06, 2009 - 08:52 AM GMTBy: The_BullBear

 The recent move in gold and silver may be an important top, a decisive breakout or a prelude to a shakeout of weak hands before the real move. Let's examine the potential scenarios.
BULLISH: IT'S A MAJOR BREAKOUT
Since the move has been to the upside we'll examine the bullish view first. From a fundamental perspective, gold bulls cite the massive inflationary forces unleashed by the world's central banks and governments as well as the systemic risks to the global economy stemming from the ongoing debt bubble. Some proximate causes for the recent surge in metals prices may be China's call to its citizens to accumulate gold and its central bank's plans to step up its gold buying program. Rumors are also circulating that China will refuse to honor derivative contracts made with Western financial institutions.
There are also concerns about a collapse of the Shanghai stock market. And of course worries of another September-October debacle in financial markets are rampant. In short, systemic risk, whether real or imagined, may have been an important factor in the recent surge and may continue to feed a bullish move in precious metals prices. The recent price move and any additional run may be forecasting financial, economic and political conditions currently known only to the market's collective intelligence (and the select coterie of elite insiders that run the planet). It's also worth noting that the spike in metals occured without any accompanying drop in the US Dollar Index. Is gold anticipating a breakdown in the Dollar? The gold bull may be driven higher and higher as governments and institutions seek to diversify out of the dollar.
On a technical basis, from September 2-3 gold and silver staged an impressive breakout from an intermediate term triangle formation. Here's the chart:

We can see that price leapt over two major levels of resistance without a pause and came to rest at the final downtrend line formed by its two prior peaks. There was an associated spike in volume on GLD. Also note that a bullish 50/200 EMA crossover occured back in January. Also, RSI appears to have undergone a range shift with low RSI readings in the 40's. Price is now challenging the neckline of what would appear to be a massive reverse Head and Shoulders pattern.
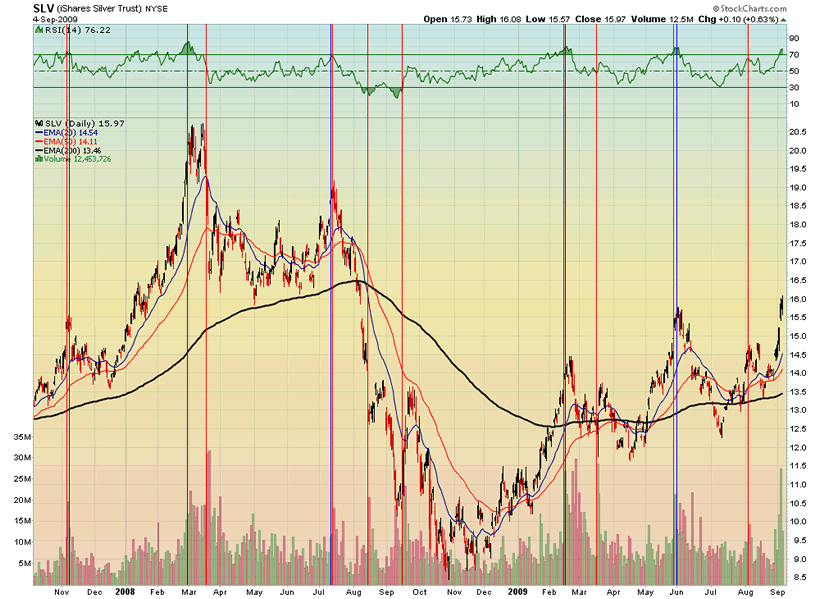
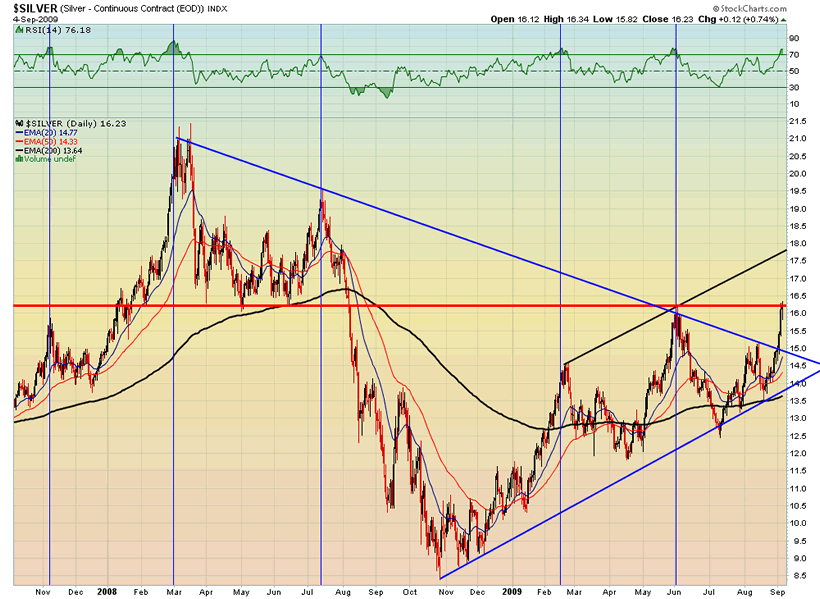
Silver's move is potentially even more bullish than gold's as it leapt over the upper boundaries of both intermediate and long term triangle formations. Unlike gold, all of its moving averages are rising sharply.
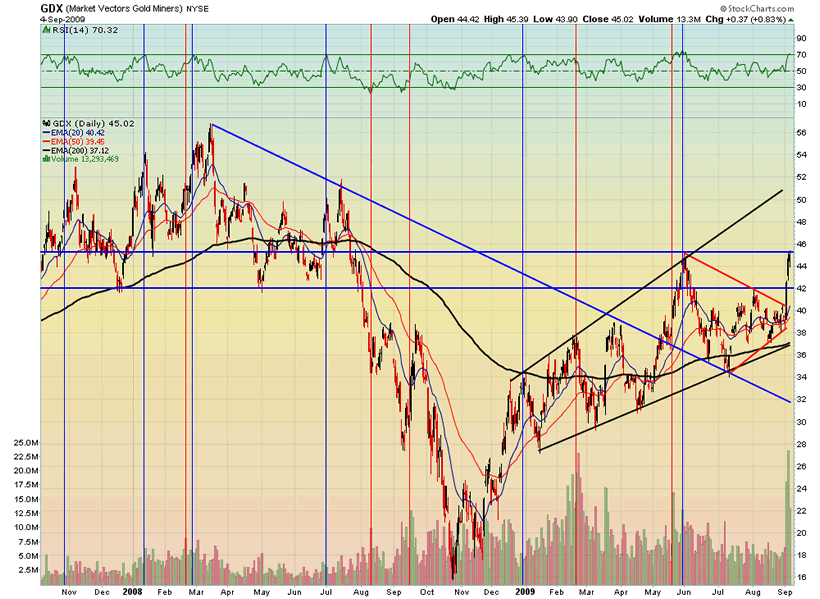
It's important to see confirmation of any bull move in the metals with and associated move in the gold and silver mining sector. Here's the chart of GDX, the precious metals miners ETF:

The miners have also broken out of an intermediate term triangle consolidation after having previously trumped its bear market downtrend. The move came on record volume and a golden cross has been in effect since May. The ETF broke through the lower boundary of its horizontal resistance zone easily this week.
BEARISH: IT'S A TRIPLE TOP AND A FAKEOUT
 Gold has gone absolutely nowhere as the rest of the commodity complex and equities have surged in spite of the greatest financial crisis since 1929 and the most awesome monetary inflation since the Weimar Republic. The recent move came on a week preceding a holiday when many market participants were on vacation. In general, markets experienced low volume. It may have been easy for traders to push the very small precious metals markets around under these conditions. Momentum traders, with little else to jump on, may have piled on board, pushing the move along. Although volume was above average on the metals ETF's it was not spectacular in comparison to past volume spikes. Since the general market action was uneventful, the financial news media chose to focus on the metals move as well, featuring stories about the "inevitable" move to much higher prices.
Sentiment on the precious metals is almost uniformly bullish. A survey of blog and guru sites turned up ONE article which advised caution at this time. Even more ominous, CNBC and Bloomberg have been pumping gold and silver for over a year and gold also went public as television, radio and print ads for gold swamped the media from the Superbowl forward until very recently when they went dark. Everyone who could possibly want to be in gold has been brought into the trade. If you were to review the blogs and postings of die hard gold bug analysts you would find that they have all opined at one time or another that when the public is widely involved in gold that that would be the top. Well this has happened...and without a commensurate bubble run in the metal. Yet there is strange silence on this major contrarian signal. It may be the most crowded trade in the markets today for the size of its market. The most crowded trade in the world (perhaps in the history of financial markets) is short the US Dollar. From a contrarian perspective this is a big red flag.
One might also contemplate that gold has enemies in the highest of places with the ability to sell phantom metal into the COMEX at will. They can also spark a bull move in the Dollar with any number of moves.
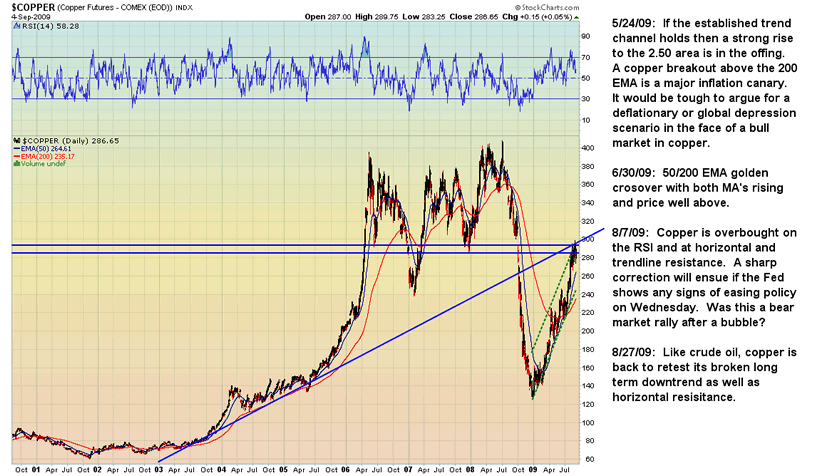
The long term chart shows a massive triangle top. Compare the chart of gold below to the chart of copper before its bubble burst. They look very similar. Could gold break out from here? Sure it could. And it could be a bull trap as well. This may very well be the chart of a distribution top.
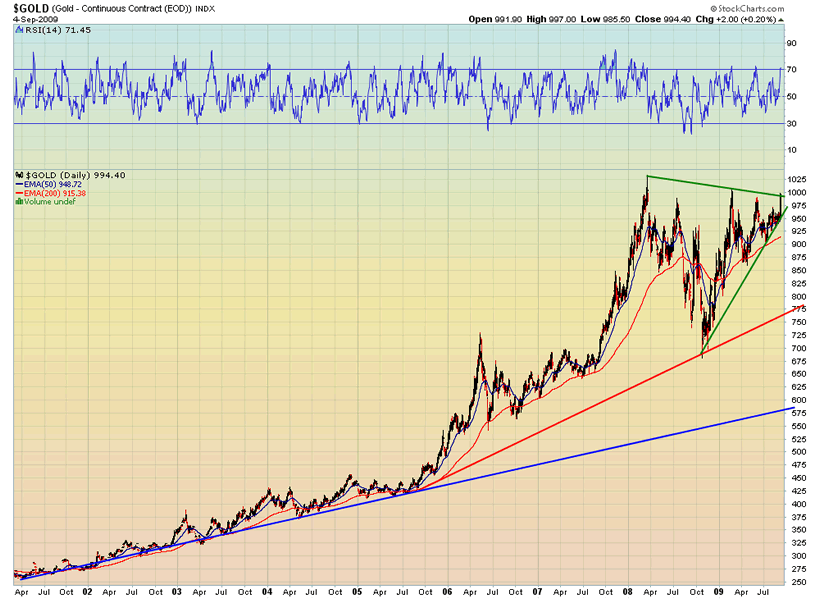
Let's look at that gold chart again. Note that readings of RSI 70 have consistently marked tops and that this has been frequently associated with volume spikes on the GLD.
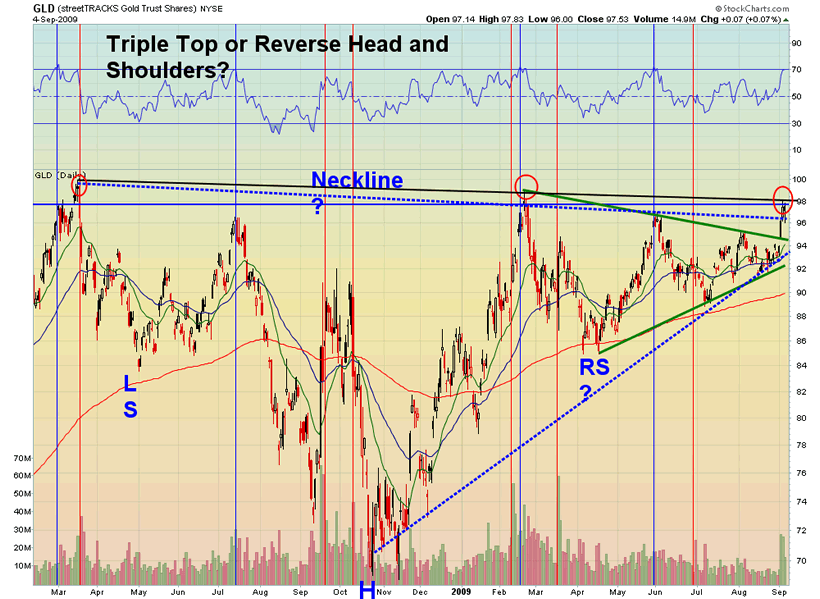
Many are seeing a reverse Head and Shoulders formation here but do not question that a bottoming formation does not generally form at a top.
The same thing holds true for SLV, the Silver ETF:
We can also see that silver is currently at major horizontal resistance. An immediate, sustained move above horizontal resistance for both silver and gold would be a serious systemic risk signal. How likely is that?
GDX has also seen selloffs associated with readings of RSI 70 and spikes in volume. Like the gold and silver ETF's the high volume spike may be attributed to traders piling on to the only hot trade around during a light holiday week. It is also trading at a zone of major horizontal resistance.
Gold and silver are commodities. The commodities market is anything but on fire. In fact, it has seriously underperformed world equities and is showing clear signs of being in a bear market. How likely is it that the precious metals will diverge from the entire commodities complex and surge higher? That would be an extreme systemic risk signal indeed! Let's look at some charts:
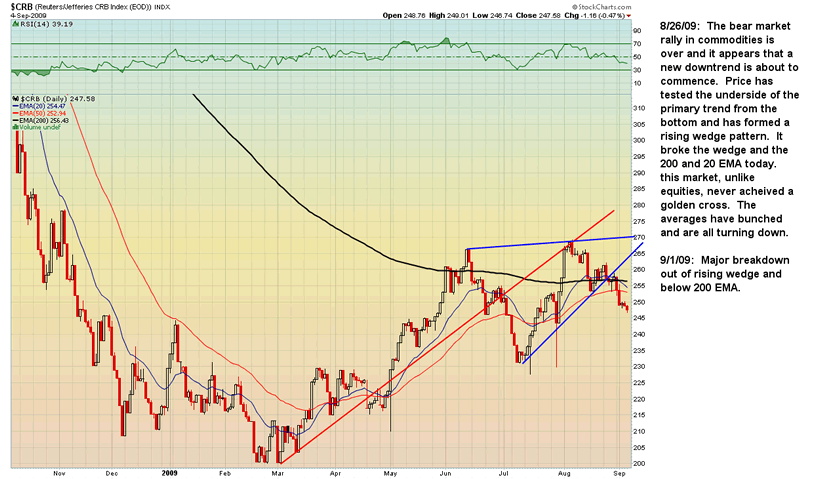
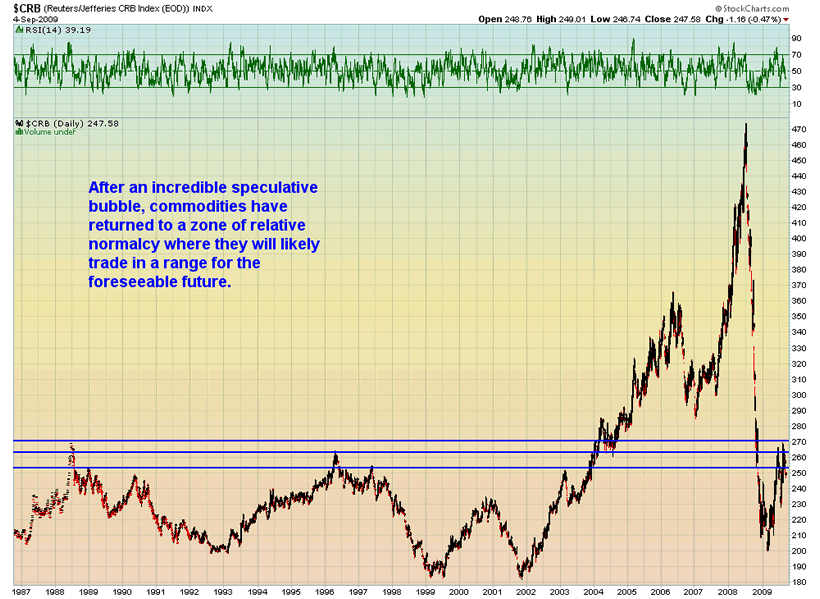
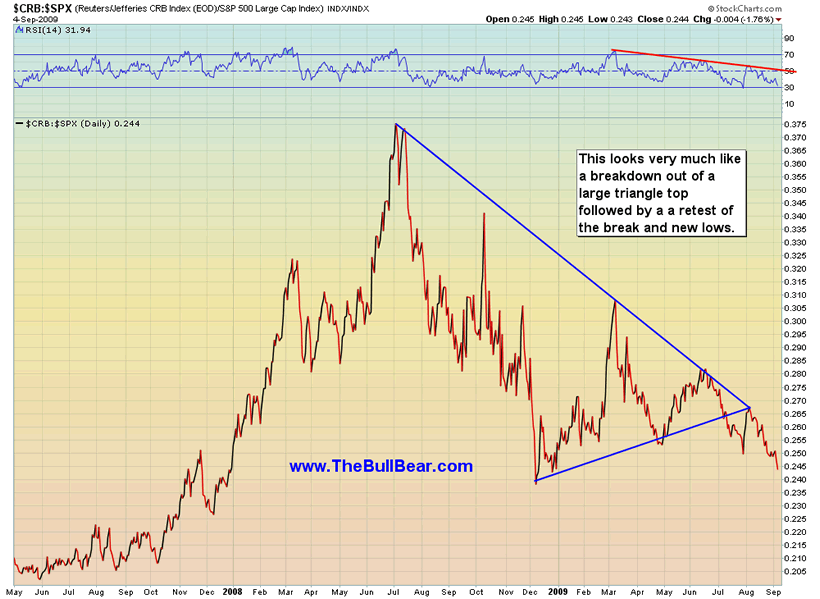
Objectively these are charts of a market that is now in a bear trend after a speculative bubble. The near term and long term for CRB is sideways to down.
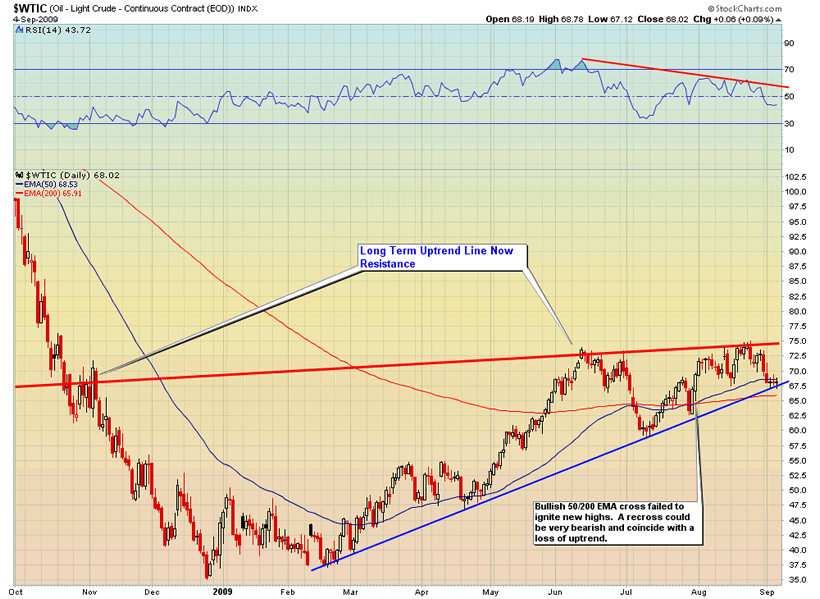
Could crude oil break out from here? Sure. But it is trading up against its long term uptrend line which has rejected price three times already. RSI is in a downtrend. Equities have made much higher highs but crude oil has not.
Even after the massive money printing by central banks and Keynsian spending by governments worldwide that we have seen in the last year commodity prices are not keeping pace with equities. While stocks continue to surge higher, commodities are lagging, particularly since June. The CRB: SPX ratio is showing a definite bear trend.
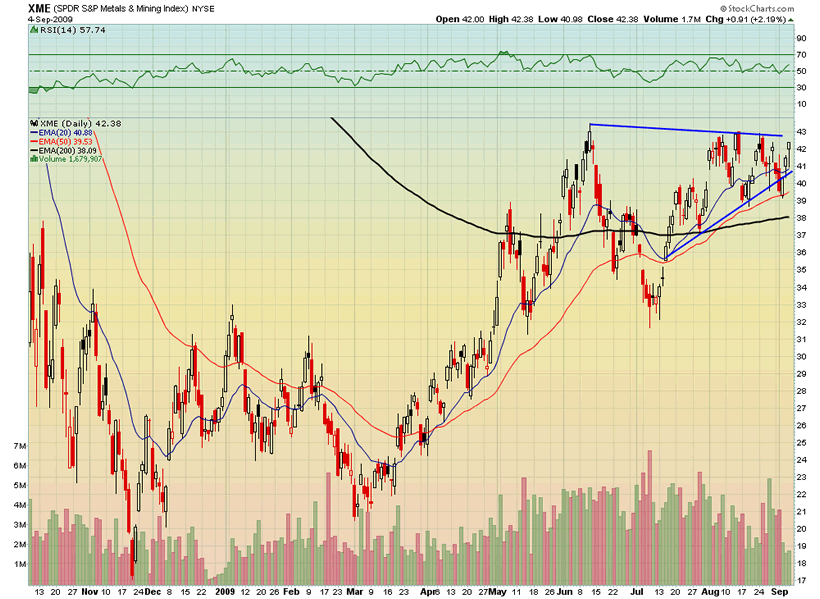
The Metals and Mining ETF shows a similar dramatic underperformance and topping formation.
With any luck gold will not repeat copper's performance when it broke out to new highs after a very similar period of volatile consolidatin that turned out to be a distribution pattern.
The Dollar, which generally trades against gold, is showing signs of bottoming. Only in the case of an extreme systemic risk profile could the two rise strongly together for a protracted period of time. Is another wave of financial crisis in the offing? How likely is that?
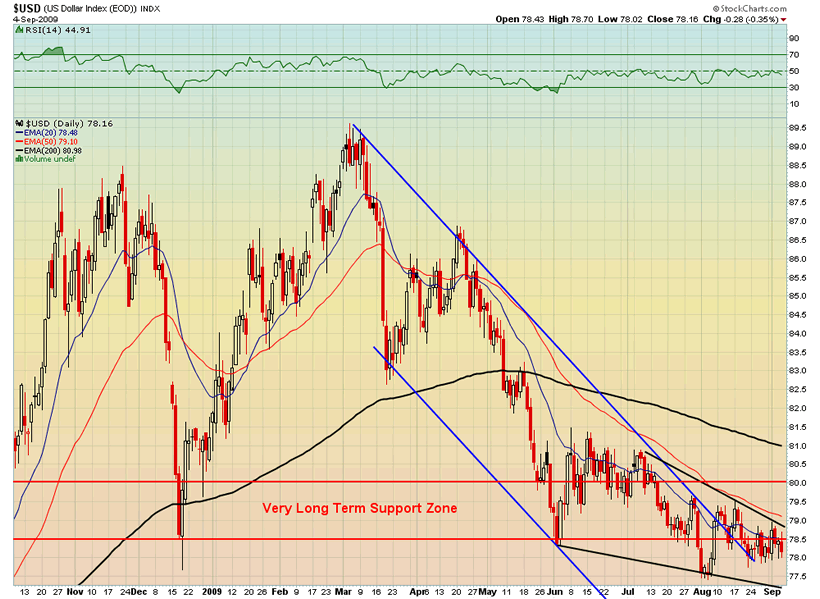
Could the Dollar plunge from here and begin the much looked for "collapse" that gold bugs have been anticipating for the last 30 years? Sure! It could happen. But the technicals do not seem to support that outcome at this time.
Under the bearish scenario, a plunge from here (or higher) back into the triangle and a weekly close below GLD 92 would signal an end to the bull market in precious metals. Gold and silver will join the rest of the commodities complex in a bear trend, trading sidways to down for a protracted period of time.
LONG TERM BULLISH, INTERMEDIATE/SHORT TERM BEARISH: A SHAKEOUT OF WEAK HANDS IS NEEDED
 Overall the above evidence--barring another as yet unforseen "Black Swan" type of event--seems to be weighted towards the bearish side. One could conclude that on a short to intermediate term basis a bit of fear needs to be injected into the precious metals markets with a serious shakeout. Hopes need to be dashed, regret needs to be engendered and towels need to be thrown in. Markets just love to do that to investors as a matter of course. Once such a process of clearing the fast and weak out of the market has been undertaken, then the precious metals may be set to take their long-anticipated trip "to da moon". Under this scenario, support may be found around the breakout from the recent triangle formation. There may be a period of backing and filling between that level and the highs until a final breakout after a period of time sufficient enought to vex and perplex the maximum number of traders and investors.
Where do I stand? "I'll take Door #3, Monty." Unless a nasty Black Swan is waiting in the wings (and that is a possibility), then the overall technical and sentiment picture does not favor a sustained move above the 1000-1032 level at this time. I'll be trading in and out of the metals and trying to make some money on the volatility since I don't think that there will be a sustainable trend in either direction. Meanwhile I'll keep my eyes and ears open for the flapping of black wings in flight.
Listen to The BullBear Market Report with Steven Vincent every Monday and Thursday LIVE after the closing bell.
By Steve Vincent
The BullBear is the social network for market traders and investors. Here you will find a wide range of tools to discuss, debate, blog, post, chat and otherwise communicate with others who share your interest in the markets.
© 2009 Copyright Steven Vincent - All Rights Reserved Disclaimer: The above is a matter of opinion provided for general information purposes only and is not intended as investment advice. Information and analysis above are derived from sources and utilising methods believed to be reliable, but we cannot accept responsibility for any losses you may incur as a result of this analysis. Individuals should consult with their personal financial advisors.
© 2005-2022 http://www.MarketOracle.co.uk - The Market Oracle is a FREE Daily Financial Markets Analysis & Forecasting online publication.