Will the Stock Market Also Defy September History?
Stock-Markets / Stocks Bear Market Sep 04, 2009 - 03:42 PM GMTBy: Sy_Harding
 The market has done quite a job of ignoring its history so far this year.
It experienced a sizable loss of 25% in January and February, during its usually positive winter months, not launching into a sizable rally until March (while still in its historically favorable period).
But that rally continued to roll right through May, defying its historical ‘Sell in May and go away’ history.
It did decline for four straight weeks beginning in June, following its history of “If May doesn’t get you, June will”.
The rally then resumed in July, also not unusual, as there is usually a minor summer rally.
But the summer rally continued through August, the first month of the market’s historically worst three- month period of August, September, and October.
That has a lot of people claiming that since the historical patterns have been off so much so far this year, they will therefore be off for the rest of the year.
Don’t be too sure of that.
The historical pattern for the rest of the year is that September tends to be a down month, leading into a correction low in the October/November time-frame, which is then followed by a significant rally from that low to the end of the year.
There are reasons to believe the market is setting up to follow that pattern.
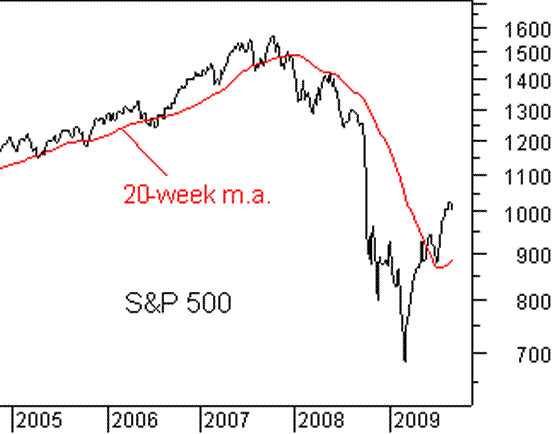
As I noted in last week’s column, we have an unusual overbought condition of the major indexes above their 20-week moving averages that is highly likely to bring a decline back down at least to the moving average, and most often overshooting on the downside.

In addition, investor sentiment is at a high level of bullishness and confidence usually seen at market tops. For instance, the Investors Intelligence Sentiment Index reached 51% bullish, only 19.8% bearish last week, its most extreme levels since the major market top in the fall of 2007. Bespoke Investment Group reported last week that the level of short-selling on the S&P 500 has fallen to its lowest level since January, which was just as that horrific January/February mini-crash began, and that the average short-interest in other major indexes is at the lowest level since the major market top in October, 2007.
The market has also already had an unusual six-month rally, in which the S&P 500 gained 52%. (Because it plunged so much in January and February, it is only up 14% for the year-to-date).
We believe that since June the rally has gotten significantly ahead of reality, factoring in a faster and larger economic recovery than is likely.
Supporting the importance of such conditions, it’s interesting to note they are exactly opposite to conditions at the important early March low, when the major market indexes were extremely oversold beneath their 20-week moving averages, investor sentiment was at an extreme of fear and bearishness, the market was beginning March, historically one of its most positive months, and we were pointing out that the market had gone too far beyond reality in the other direction, by apparently factoring in the total collapse of the financial system and the next Great Depression.
Meanwhile, the market has run out of steam over the last two weeks, managing only a fractional gain last week, and as this is being written mid-afternoon on Friday, although up for the day, looking like this first week of September will be a down week.
The Labor Department’s closely watched employment report for August, released this morning, followed its historical pattern of resulting in a triple-digit kneejerk reaction by the Dow in one direction or the other.
The report was that the unemployment rate jumped to 9.7% from 9.4% in July, worse than the rise to only 9.5% that economists expected.
But there were ‘only’ 216,000 jobs lost in August, 9,000 fewer than the 225,000 that economists had forecast. However, the previous reports of June and July were revised to show 50,000 more jobs were lost in those months than had been reported previously. Something for both bulls and bears.
The market followed its typical triple-digit reaction to the report, with the Dow up 101 points by early afternoon.
However, as I have often noted in this column, the other side of that pattern is that whatever the direction of the market’s initial reaction to the jobs report, it is usually reversed within a day or two, and the market goes back to focusing on whatever were its driving forces before the jobs report.
By the way, next week is also the week before this month’s options expirations week, and the week before tends to be negative.
So we shall see.
Sy Harding publishes the financial website www.StreetSmartReport.com and a free daily market blog at www.SyHardingblog.com.
Disclaimer: The above is a matter of opinion provided for general information purposes only and is not intended as investment advice. Information and analysis above are derived from sources and utilising methods believed to be reliable, but we cannot accept responsibility for any losses you may incur as a result of this analysis. Individuals should consult with their personal financial advisors.
© 2005-2022 http://www.MarketOracle.co.uk - The Market Oracle is a FREE Daily Financial Markets Analysis & Forecasting online publication.


