World Wide Stock Market Crash on Pause
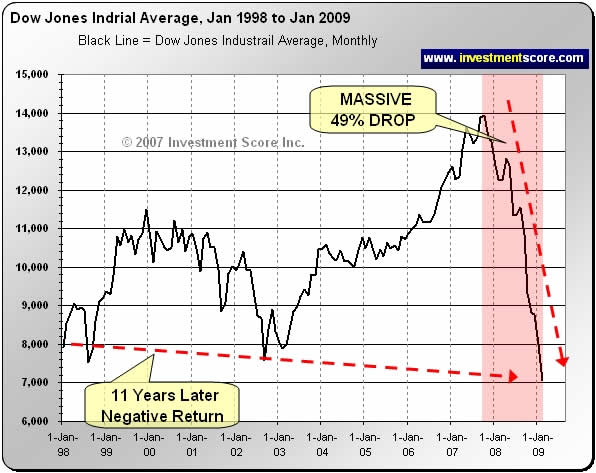
Stock-Markets / Financial Crash Sep 03, 2009 - 02:41 AM GMT Don't Be So Sure - Things Aren't Exactly 'Normal' - Starting in late 2007 and through 2008 a historic, worldwide market crash brought some of the largest corporations in the world to their knees. Between bankruptcies and bailouts, many massive financial institutions have been struggling simply to keep alive. Trillion dollar currency markets have been thrashing up and down like penny stocks. The largest housing bubble in history has popped with governments intervening and thereby prolonging the effects. Worldwide trillions of dollars in market equity has been lost.

So the critical questions we ask ourselves are:
- Is it realistic to think that the effects of these types of devastating events will be resolved in a matter of months? We don't think so.
- Knowing that markets do not move up or down in a straight line, does it seem logical that the markets are now off to a new long term bull market; or could they be experiencing a temporary bounce? We think that history would suggest a bounce.
- Given the huge amount of volatility in the market, does it make sense that in the short term many good indicators such as seasonal trends could be less reliable? We think so.
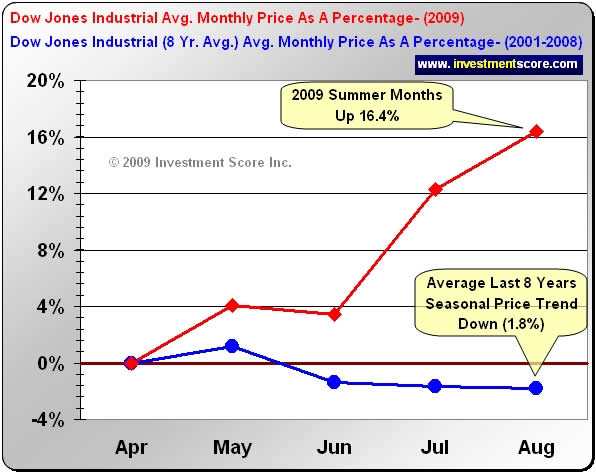
Because of the historic drop in all markets we predicted that this summer's seasonal trends would be different than most years and instead of a falling market we would see a rising market. The following chart illustrates the monthly percentage gains of the Dow Jones Industrial Average compared to an average of the monthly percentage gains over the last eight years.

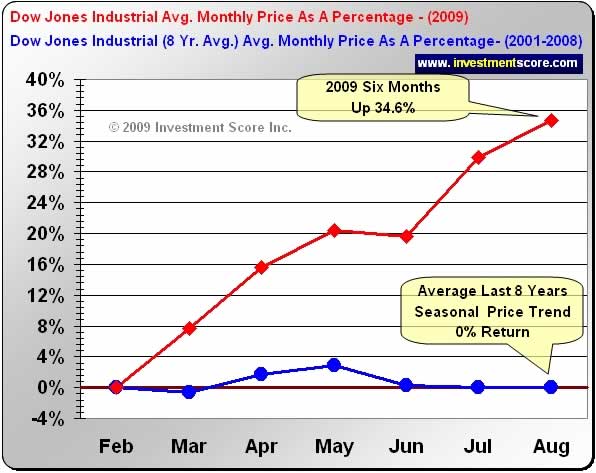
As you can see in the chart above, which is based on the past four years of data averaged together, the typical weak summer months of July and August were very strong in 2009. This year the seasonal trends are different, showing a mega bounce which followed a mega drop. In other words the pure power of the markets momentum trumped the power of the typical seasonal trends. Our next chart illustrates how big that mega bounce has been since February of this year.

Based on the last eight years of monthly Dow Jones Industrial Average data averaged together, the above chart helps illustrate just how big the market bounce has been since February. Similar to a rubber band being stretched, when the market fell hard and fast over 2008, it was inevitable that a snapback rally, like the one we are seeing today, would follow. It is this momentum driven bounce that we believe is taking the market higher rather than fundamental influences such as seasonal trends. Once again we can visually see how the markets momentum, in this situation, is much more important than seasonal influences.
We are not suggesting that prices within the Dow Jones and other markets cannot head higher from the date of this article. In fact it would not surprise us if the markets in general started a new drop now or if it continued to climb until March 2010. However, it is our opinion that the fundamental problems within the US and around the world are monumentally big and we believe the recent worldwide market drops are evidence of that. We do not believe such massive imbalances can be quickly resolved and we do not believe the typical seasonal patterns are as reliable this year as they have been in the past. Anything can happen in the markets and we cannot guarantee that the US markets are going to test or possibly break through their old lows in the not too distant future. Unfortunately we do not have a crystal ball. However, we do not think these markets are off to another long term bull market and we are very skeptical that this potential bounce will last too much longer.
To learn more please visit us at www.investmentscore.com. Here you can sign up for our free newsletter, read more free articles such as this one and learn more about our strategies. Finally, if you enjoyed this article we ask that you forward it on to those you think would benefit from it. Good luck out there.
By Michael Kilback
Investmentscore.com
Investmentscore.com is the home of the Investment Scoring & Timing Newsletter. Through our custom built, Scoring and Timing Charts , we offer a one of a kind perspective on the markets.
Our newsletter service was founded on revolutionary insight yet simple principles. Our contrarian views help us remain focused on locating undervalued assets based on major macro market moves. Instead of comparing a single market to a continuously moving currency, we directly compare multiple major markets to one another. We expect this direct market to market comparison will help us locate the beginning and end of major bull markets and thereby capitalize on the largest, most profitable trades. We pride ourselves on cutting through the "noise" of popular opinion, media hype, investing myths, standard over used analysis tools and other distractions and try to offer a unique, clear perspective for investing.
Disclaimer: No content provided as part of the Investment Score Inc. information constitutes a recommendation that any particular security, portfolio of securities, transaction or investment strategy is suitable for any specific person. None of the information providers, including the staff of Investment Score Inc. or their affiliates will advise you personally concerning the nature, potential, value or suitability or any particular security, portfolio of securities, transaction, investment strategy or other matter. Investment Score Inc. its officers, directors, employees, affiliates, suppliers, advertisers and agents may or may not own precious metals investments at any given time. To the extent any of the content published as part of the Investment Score Inc. information may be deemed to be investment advice, such information is impersonal and not tailored to the investment needs of any specific person. Investment Score Inc. does not claim any of the information provided is complete, absolute and/or exact. Investment Score Inc. its officers, directors, employees, affiliates, suppliers, advertisers and agents are not qualified investment advisers. It is recommended investors conduct their own due diligence on any investment including seeking professional advice from a certified investment adviser before entering into any transaction. The performance data is supplied by sources believed to be reliable, that the calculations herein are made using such data, and that such calculations are not guaranteed by these sources, the information providers, or any other person or entity, and may not be complete. From time to time, reference may be made in our information materials to prior articles and opinions we have provided. These references may be selective, may reference only a portion of an article or recommendation, and are likely not to be current. As markets change continuously, previously provided information and data may not be current and should not be relied upon.
Investmentscore.com Archive |
© 2005-2022 http://www.MarketOracle.co.uk - The Market Oracle is a FREE Daily Financial Markets Analysis & Forecasting online publication.


