Six Million Home Foreclosures: Next Ticking Lehman-Style Bomb…FDIC Insured Banks?
Housing-Market / US Housing Sep 01, 2009 - 07:04 AM GMTBy: Andrew_Butter
 Over a year ago Hank Paulson declared "The US Banking System Is A Safe and Sound One", the market's reaction to that piece of news was to short Fannie and Freddie into oblivion. A key issue there was holdings of mortgaged backed securities, specifically RMBS; valuations of those things depended on (a) their credit rating, (and once the LTV started to slip the rules said they had to be downgraded, so the price tanked), and (b) there was a rule of thumb that the value of those things was what an equivalent Treasury cost, less the cost of a CDS to insure them; when fear took over, the cost of a CDS went through the roof, the "market" (it never was a real market), froze. Then there was Lehman.
What drove that crisis was fear of the future, and the reason so much money was required to bail out the players ($2.7 trillion so far) was that previously if you had a "good credit score" you could borrow short-term Treasures, and buy an RMBS on 100% margin, and make a fortune; then the margins got called.
What happened was nothing different from a gambler going into a casino, borrowing from the house, using that money to bet on a "sure thing", and losing. Lucky for the gambler the "house" decided he was too big to fail, if you or I were to do something like that, we would be lucky to get away with a pair of broken legs.
Now the future is threatening to arrive:
There are two issues, (a) how much of that $2.7 trillion paid out mainly by the Fed (largely without any oversight by Congress), will get paid back (b) what's going to happen to the legacy banks who (then) had the luxury of being able to "take a view" on their portfolios of "originate and hold", and make a provision.
Right now the "reserves for losses" of FDIC insured banks is $211 billion on a portfolio of $7.625 trillion of loans and leases plus another $1.365 trillion of RMBS. In the circumstances that looks a tad light.
But the dice is still rolling, where it ends up will determine how much the "Too Big To Fail" card-sharks, pay back, and how much of the $1.422 trillion of equity capital of the FDIC banks gets destroyed.
It's sometimes easy to forget that in this war the front line is foreclosures; although you wouldn't think that from the news. All you get is occasional pretty charts from the Mortgage Bankers Association with percentages (it's never quite clear of what), plus sound bites from the rating agencies like "the cure rate went down last month" or from RealtyTrac: "total filings went up last month".
From that trickle of managed, massaged and censored dispatches, it sounds suspiciously like somebody (or some-bodies), is trying to hide something.
Like a ticking bomb?
Perhaps the bottom in house prices was in May or perhaps there will be another leg down, but that's starting to be academic; a bottom is somewhere in the neighborhood. The story now is foreclosures; that's what drove house prices down to where they are now and that's what will keep them down. The acid on that cake and the nightmare for anyone in negative equity, is how many there will be by the time this is all over?

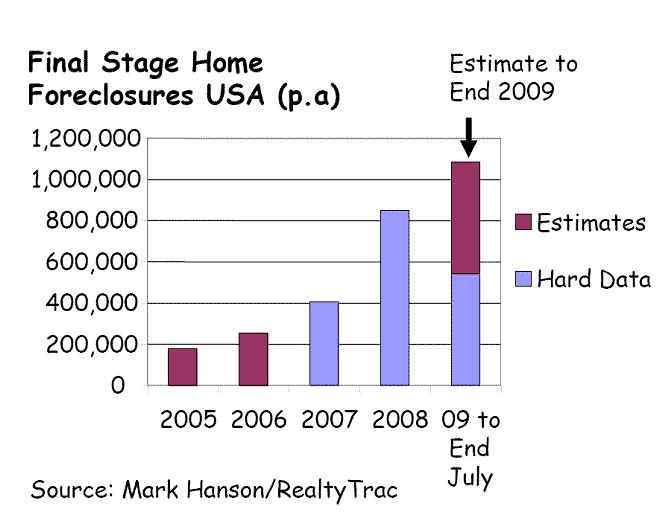
Since January 2005 over two million homes in USA have been foreclosed, that's about 1.7% of the total housing stock. Many of those were family homes, so that's probably already directly affected about 3.5 % of the American population.
This is the Bomb:
Right now in USA there are over two million mortgages in either the first stage or the second stage of foreclosure; a large majority of those will end in foreclosure. At the current rate of "clearance" it will take two years for all of those to be processed.
And that's not counting new ones getting added to the pipeline at a rate of about 100,000 a month. That's clearly not something that anyone thought worth mentioning in the one hundred pages of turgid drivel "The Industry" shoveled out over the past three months; that I ploughed through to make sure I got it right (dear reader - just for you). And you wonder why there is a credit crunch?
The News Is, It Ain't Pretty
The headline data that is typically released, for example by RealtyTrac (i.e."360,000 Filings In July") is an aggregation that has to be disaggregated to make any sense of it, there are three stages:
- Stage 1: A notice of default is posted in the County Recorder's Office
- Stage 2: A Notice of sale is announced
- Final Stage: A public auction supervised by the trustee who transfers the deed.
The borrower can normally "cure" the process at any point, typically up to five days before the date of sale, although some mortgages give the lender the power to push through to disposal of the property as soon as the loan becomes delinquent. In most cases the process is non judicial and governed by the wording of the mortgage so there is no requirement to involve the Courts and the only option the borrower has to stop or delay the process is to pay up.
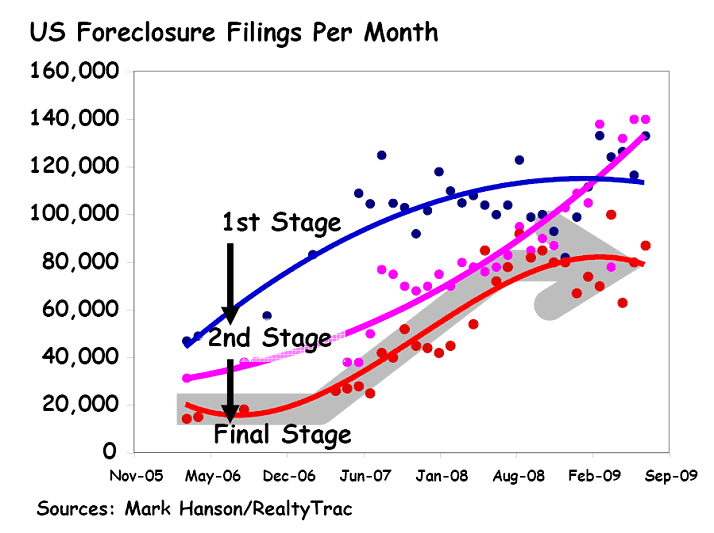
It's hard to get data, the best source I found was Mark Hanson (http://mhanson.com/) plus there was data here and there from RealtyTrac (http://www.realtytrac.com/). This is what I managed to cobble together:

That's not complete data, presumably that exists somewhere but it's not in the public domain. The reason there are more 1st Stage than 2nd Stage than Final Stage is (a) because some mortgages are cured (no hard data on how many) and (b) because the flow through from 1st to 2nd and Final is not linear.
An optimist might say that it looks like there is a top developing since Stage 1 and Final Stage are flattening; here are some theories:
1: That could perhaps be due to the recent moratorium from Q-4 2008 through Q-2 2009; but perhaps all that did was increase the backlog, and cure rates for those are going down (according to Fitch).
2: Another possible reason could be that the "system" just can't handle more than about 80,000 final foreclosures a month, perhaps that's about the limit. In 2005 the average was less than 20,000 a month, 80,000 is a 400% increase. For every foreclosure somebody from the lender has to show up and make decisions, the trustee has to show up and administer the auction and transfer the deed, perhaps there just aren't enough "somebody's" who understand the procedures to go round?
3: There again it might be that the lenders could be trying harder to look for ways to modify loans so that foreclosure can be avoided; that takes time (putting together an offer, squaring it away - particularly if the loan is part of a pool and the pool has covenants, then getting an answer back from the borrower, perhaps negotiating).
4: Or could it be that when a loan goes from "Non-current" to "loss" the banks or the service providers in the case of RMBS or CDO, have to book that number as a loss, not a provision? And that really messes up "mark-to-fantasy" accounting.
Which?
This is a plot of the difference between the S&P Case-Shiller 20 City Index and the final foreclosure number with a six-month lag, starting at the top where it was 207 (i.e. in January 2008 the Index was 181, so the difference is 26 and that's compared to foreclosures in June 2008 on the chart (six months later)). That's a measure of the Negative Equity of households.
This is the way I read that chart:
1: There is clearly a relationship between Final Stage foreclosures and the amount of "negative equity"; also the moratorium had an effect, if the trend line had continued by now there would be 160,000 final foreclosures a month (assuming there had been enough capacity to deal with them), so in that sense the moratorium was a success, it "saved" 570,000 homes from foreclosure.
2: It looks as if the moratorium also slowed down the number of 1st Stage filings which appear also to have stepped down from where they were headed in July and August last year, but are clearly driven by the "negative equity index", although thanks to the moratorium, the effect of that was from a lower base. So perhaps 400,000 1st Stage filings were "saved" there.
That appears to go against the theory that the moratorium encouraged or encourages people to default.
It's interesting how bankers, accountants and rating agencies never seem to miss an opportunity to blame their incompetence on the innate dishonesty, lack of personal ethics and downright crookedness of ordinary Americans, as if this whole thing was caused by Liar Loans, i.e. Liars. One of the turgid self-satisfied reports I read was about how the FBI "ought" to mobilize up to catch the people who "lied" as if that was what caused this disaster. Well I've met a lot of bankers, accountants and people from rating agencies, and I've also met a lot of ordinary Americans, and I don't think that I need to explain where my sympathies lie in that department (http://seekingalpha.com/article/157808-liar-loans-not-the-problem). The track of the blue dots appears to prove my point.
It is likely also that easing off on foreclosures, was one, and perhaps the only reason for the recent "bounce" in the S&P Case-Shiller Index (helped perhaps by seasonal factors).
The Effect Of The Moratorium
The problem is that over the past nine months, despite the moratorium, another 1.2 million new 1st Stage Fillings were made, yet "only" 850,000 "left" the system to foreclosure, so that's another 350,000 in the system on top of the estimated 1,750,000 that were in the system in the first place (1st and 2nd Stage).
So that's 2,100,00 still "stuck" in the system, less the "cures", which are hard to gauge, I could not find consistent data on that.
Although if you have gone past the 1st Stage to once an auction date has been set (2nd Stage), the chances of modification or cure are much less; and from the first chart it is clear that the moratorium had little or no effect on the progression from 1st Stage to 2nd Stage. That suggests that unless new measures are brought in, the system might simply be playing catch up.
How Many More to Come?
The issue is whether slowing down foreclosures is simply delaying the inevitable, or really helping to mitigate the long-term damage.
It's perhaps worth remarking that when an "originate-to-hold" mortgage goes bad (I estimate those account for about 30% of mortgages that are at risk), the lender (directly) loses the difference between the amount outstanding on the loan and whatever is recovered from foreclosure. Theoretically they also lose the prospect of future income from interest payments, but that's theoretical, that is not a loss that they have to write down.
For an RMBS a foreclosure is more damaging; obviously the damage is initially concentrated on the lower tranches; but a significant part of the "face" value of an RMBS is the capitalization of future income streams.
That's why the analysts were always so concerned about the "deadbeats" who might pay their mortgages back in full, in advance; although that's not something many people are staying up all night worrying about these days.
The rate of foreclosure thus hits owners of RMBS (toxic assets) a lot harder than "originate-to-hold"; it is perhaps significant (and alarming) that the Stress Tests did not explicitly model foreclosure rates, because that's the real driver of losses.
What is clear now is (a) there is a backlog (b) it is likely to spill over (c) there is a clear link between the drivers of foreclosure and negative equity, and although there is "hope" that prices may rise, it is highly likely that once the moratorium gets lifted, final foreclosures will rise, and that will drive house prices down more.
Where will it end up?
The "score" day-by-day is just a distraction, what matters, is in the end, where it ends up.
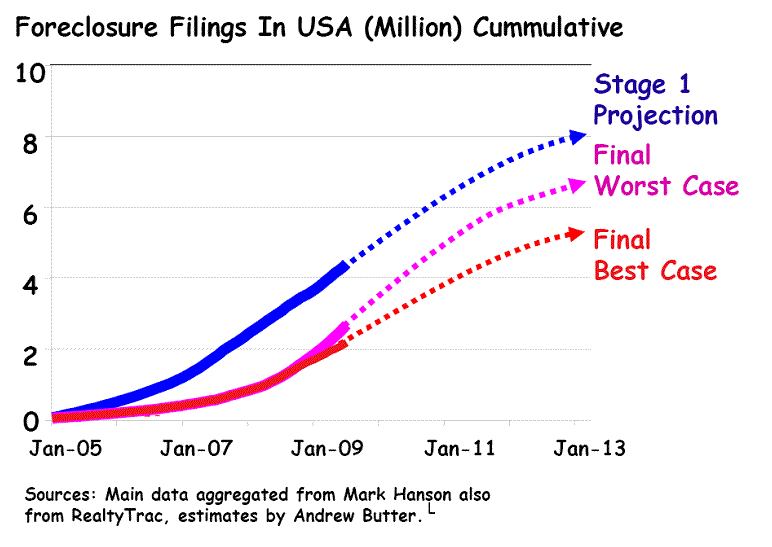
This chart shows the cumulative number of 1st and Final filings, the most likely outcome is that that the "shape" of the cumulative graph will be an "S" curve.
The shape of the 1st Stage line pretty much perfectly "normal" going up and it's likely it will be "normal" going down, that is shown in the dotted blue line, suggesting that by the "end of play" there will have been about 8 million 1st Stage filings.
The "Best-Case" dotted red line is a "normal" progression from where Final Stage foreclosures ended up. The "Worst Case" is based on the assumption that the moratorium achieved about nothing long term and the trend will at some point revert to the "natural" progression is driven by the negative equity index, the line is based on an average 0.5% increase in the S&P Case-Shiller going forward.

If the "worst-case" comes to pass probably about 10% of the population of USA will have been evicted from their homes by the end of the credit crunch.
Working out what the final score might be
A set of accounts is presented like something set in stone, as if for a moment time stood still and those numbers reflect the true financial position of a company. In a world where not much changes, that works great, but a snapshot of a suicide bomber the second before he pulls the trigger, tells you nothing about what will happen next. Evidence the glowing financial statements of Bear Sterns, Lehman, AIG, Freddie, and Fanny, moments before they exploded.
A set of accounts is a prediction with all the uncertainty of a crystal ball, particularly in the case of a bank. The prediction is how much assets held on the books will be able to be sold for at some unspecified time in the future. Even a mark-to-market valuation is a blind prediction of the future, because that tells you what you could have sold an asset for yesterday, with the implicit assumption that that is a reasonable prediction for what you could sell it for tomorrow.
Accountants, auditors, bankers, bank regulators, will all tell you that is not true, and that a set of accounts is simply a catalogue of events that happened in the past. That is a dangerous delusion.
An example:
The Q2-2009 FDIC Quarterly Banking Profile contains a line item for MBS (probably mainly RMBS), which are valued at $1.365 trillion. In Q2-2008 it reported that the value of MBS that they held as assets, was $1.322 trillion. But quite a lot happened between Q2-2008 and Q2-2009.
There is no easy way to find out how those assets were valued, although one suspects that they are being held at "face" value which is basically what they were bought for. Or if not, perhaps for example the MBS held in 2008 were re-valued at half of what they were valued at then, (which given the events that occurred might have been "prudent"), then perhaps they bought some more, and that could explain why after the biggest period of re-examination of values of MBS that occurred in history, the value of FDIC holdings of MBS went up 3.3%? Perhaps and perhaps there are fairies at the bottom of the garden?
There is no easy way to tell from the accounts, there is no easy way either to tell how many of those "assets" were (once) the "good stuff", i.e. the AAA tranches distilled out of mortgage pools and which were easy to sell, and how much was the "really toxic stuff" rated BBB and less, that no one wanted to buy, and got left behind.
It makes a difference, but the casual observer doesn't get to see that level of detail, he must rely on statements like "I hereby certify that these accounts conform to US GAAP", and "The US Banking System Is A Safe and Sound One".
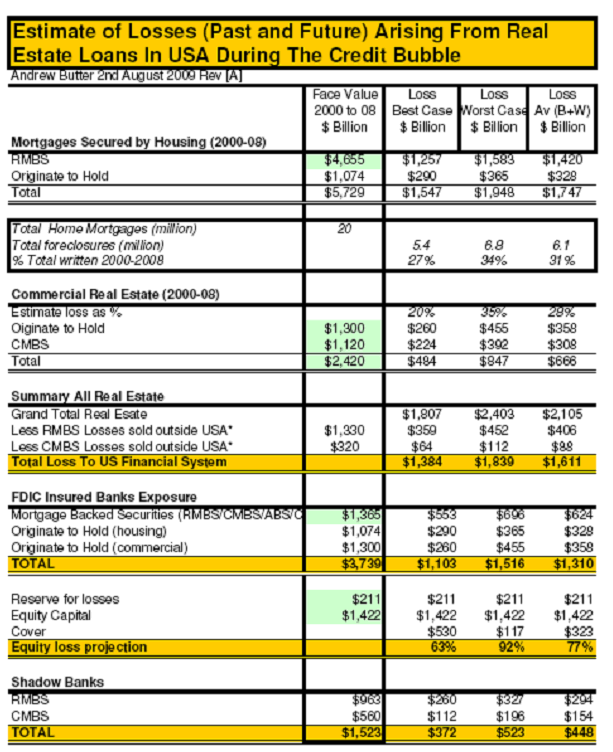
In the absence of any numbers that I could understand, I decided to work it out for myself, or at least to work out how much the loss is likely to be in the future, when all of those foreclosures have been auctioned off.
The numbers highlighted in green are hard numbers, the rest are estimates:

So who was "Too Big to Fail"?
Worst case $1.56 trillion for FDIC insured institutions!
It occurs to me that the potential losses of FDIC insured banks (some of which are "Too Big To Fail", might well be more, much more, than the potential losses of the Shadow Banks (I'm of course not counting the game of Mexican Sweat they were playing with CDS).
The bail-outs together with the Stress Tests (un-stressful as they were but that's just another word for forbearance), saved the too big to fail banks, there is no doubt about that.
But that was "protection" from an event that the market anticipated might happen in the future, namely foreclosures on real estate, leading to losses.
A question that might profitably be asked is what for?
Little of the $2.7 trillion that was shoveled into the "Too Big to Fail" banks has found it's way out into lending to keep the US economy moving; it appears that the "gamblers" are quite happy to make hay on the yield curve, and making 125% LTV loans to hedge funds (as if lending more money than the collateral you stand to collect if things go wrong, was not something that caused the credit crisis in the first place)? Plus of course buying super-computers to game the stock markets.
It's not clear to me what useful economic function that serves?
And yet it looks to me like perhaps the backbone of the "legacy" banking system, that has served America well for some time, and that was not directly implicated in the mass suicide attempt that led to the current crisis, is about to be exploded; like a surplus to requirement hotel in Las Vegas.
I'm not convinced that the $2.7 trillion (and the "unlimited" trillions held in reserve), might not have been better employed saving those banks, than the gambling dens.
Perhaps my numbers are wrong?
That is very possible; after all there is not a lot to work with.
If so, then doubtless someday soon we can expect Secretary Geithner or Chairman Sheila Bair to take the stand, and declare "The US Banking System Is A Safe And Sound One"?
By Andrew Butter
Andrew Butter is managing partner of ABMC, an investment advisory firm, based in Dubai ( hbutter@eim.ae ), that he setup in 1999, and is has been involved advising on large scale real estate investments, mainly in Dubai.
© 2009 Copyright Andrew Butter- All Rights Reserved
Disclaimer: The above is a matter of opinion provided for general information purposes only and is not intended as investment advice. Information and analysis above are derived from sources and utilising methods believed to be reliable, but we cannot accept responsibility for any losses you may incur as a result of this analysis. Individuals should consult with their personal financial advisors.
Andrew Butter Archive |
© 2005-2022 http://www.MarketOracle.co.uk - The Market Oracle is a FREE Daily Financial Markets Analysis & Forecasting online publication.


