Stock Market Forecast S&P500 1400 by End 2010, and 400 by 2014
Stock-Markets / Forecasts & Technical Analysis Sep 01, 2009 - 02:47 AM GMTBy: Lorimer_Wilson
 Merrill Lynch Asia (Bank of America) strategists Sadiq Currimbhoy, Arik Reiss, and Jacky Tang suggest that the S&P 500 could soar another 40% by December 2010 before it collapses completely based on a unique comparison with the Nikkei 225. (Before you reject this possibility out of hand please read the entire article.)
Were the S&P 500 to indeed rise by 40% then, by extension, precious metals stocks (as represented by the HUI and GDM indices) and their associated warrants (as represented by our proprietary PreciousMetalsWarrants Index) would top out at record highs as would gold and silver.
Uncanny Relationship Exists (with a Twist) between the Nikkei and the S&P 500
The strategists have identified a pattern that supports the likelihood of major additional gains in the US stock market even without a strong economic recovery which suggests that the rally should continue until the end of the year. Below is an edited version of what the Merrill Lynch strategists had to say:
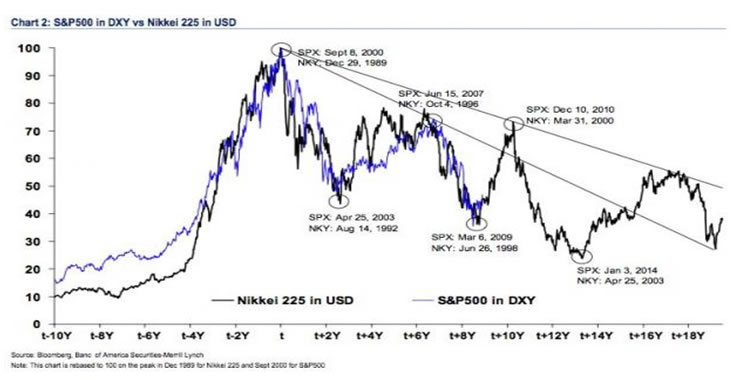
Some investors like to compare the US to Japan. From a market perspective, plotting the Nikkei and the S&P 500 shows no similarity. However, a peculiar variation shows an uncanny relationship.
The chart below shows the Nikkei in U.S. dollars compared to the S&P 500. The S&P 500 in DXY terms has been rebased to the same peak as in Japan, except 117 months (9.75 years) later. If this pattern repeats, there is potential for 40% upside over the next 3-4 months.

Assuming a relationship similar to what Japan went through, the S&P 500 in DXY terms could well rise another 40% pretty much from now until mid-December 2010. Importantly, this is in DXY terms, so if the U.S. dollar were to rally 20% and the S&P 500 17% (as it's multiplied), that would do it. If the market were to only rally to the lower trend line in the... chart, then the total upside would be 33%, split between the U.S. dollar and the equity market.
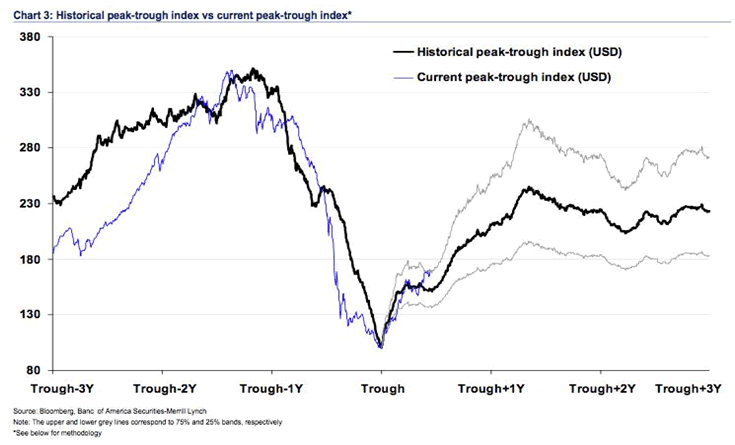
The Merrill strategists went further, constructing an equally-weighted index of all markets that have crashed more than 45% since 1970 plus the U.S. stock market crash in 1930 and then averaged the recoveries from these crashes (referred to as 'Historical Peak-Trough Index'). They found that strong "relief rallies" are common and that, should this pattern hold for the S&P 500, then it should experience a further 40% appreciation by the end of 2010.
Specifically, they looked at all the markets since 1970 that had had crashes of more than 45% in the previous 12 months in U.S. dollar terms (or 50% in local currency terms) and added in the U.S. stock market crash of 1930 to create their equally-weighted index. This is shown in the chart below with 25% and 75% bands.

Relationship Suggests S&P 500 Will Rise to 1400-1500 before Falling Back to 400
When they the Historical Peak-Trough Index was compared to markets that have recently experienced similar deterioration (referred to as 'Current Peak-Trough Index') they concluded that the current S&P 500 index looks like it's following a similar pattern and is set to peak in 3-4 months some 40% higher than the current level. That would have the S&P 500 topping out at somewhere around 1400-1500 (i.e. 5-10% less than the S&P 500's record high of 1565 in October 2007) before crashing back to it's 1994 low of 400 (when the stock market bubble first began) by the end of 2013 or early 2014.
Peculiar Variation Confirms Projections of Dent, Napier and Others
It is interesting to note that Merrill Lynch's projections, based on this approach, mirror those of Russell Napier and Harry S. Dent Jr. whom I highlighted in a March, 2009 article entitled "Dent, Prechter and Others Warn that the Worst is yet to Come (Engulf Us)." Both men, independent of each other and based on their own unique approaches to market research, maintained a year ago that the S&P 500 would rally dramatically in 2009 to mid 2010. (Dent saying the Dow would go to a high of 13,200 which, incidentally, would represent a 38% increase from last Friday's close of 9544) only to slowly decline to a bottom of 400 or so by either 2012 (Dent) or 2014 (Napier).
Napier, who wrote "Anatomy of the Bear" and teaches at Edinburgh Business School in addition to being a strategist with CLSA Ltd., based his projections on Tobin's "q" ratio which compares the market value of companies to their constituent parts. His projected low of 400 was conditional on deflation setting in, which has, because "with deflation the value of assets fall and the value of debt stay up crushing equities." No one was expecting deflation a year ago but we currently are in the midst of it which should cause us to reflect on the merits of Napier's assertions. Below are the inflation (deflation) rates year-to-date compliments of inflationdata.com:
| 2009 | 0.03% | 0.24% | -0.38% | -0.74% | -1.28% | -1.43% | -2.10% | NA | NA | NA | NA | NA | NA |
Relationship Suggests the HUI and GDM Could Rise to Record Highs
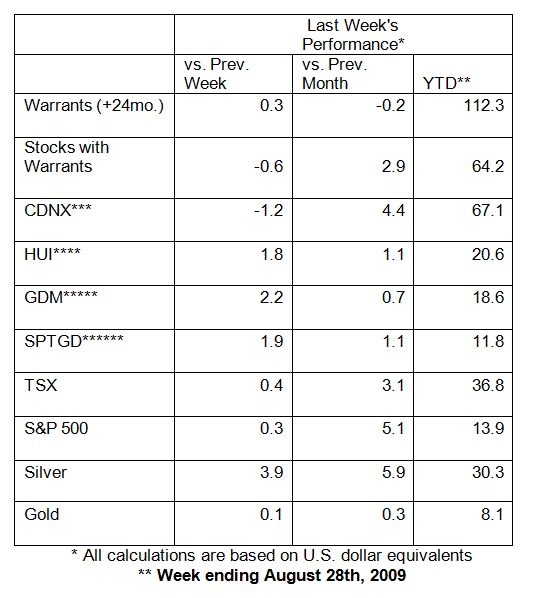
Year-to-date the HUI and GDM are up 20.6% and 18.6% respectively (see table below) or, on average, 41% greater than the S&P 500 increase YTD of 13.9%. If the S&P 500 were to appreciate 40% and the trend ratio between the broad stock market and the narrow large/medium cap precious metals mining sector were to continue one could expect the HUI and GDM to increase in the neighbourhood of 56% by year's end. That would put the HUI at around 570 (10.6% above it's all-time high of 515 in March 2007) and the GDM at about 1666 (7.2% above it's all-time high of 1553 in March 2008.) The results of the comparative analysis seem plausible.

***CDNX is the symbol for the S&P/TSX Venture Composite Index consisting of 558 micro/nano cap companies of which 44% are engaged in the mining, exploration and/or development of gold and/or silver and other mineral resources and 18% in oil or natural gas pursuits.
****HUI is the symbol of the AMEX Gold BUGS (Basket of Un-hedged Gold Stocks) Index and is a modified equal dollar-weighted index of 15 large/mid cap gold mining companies that do not hedge their gold beyond 1.5 years.
*****GDM is the symbol for the NYSE Arca Gold Miners Index and is a modified market capitalization weighted index of 31 large/mid/small cap gold and silver mining companies.
******SPTGD is the symbol for the S&P/TSX Global Gold Index and is a modified market capitalization index of 19 large/mid cap precious metals mining companies.
Relationship Suggests Gold Could go to $1175 and Silver to $27.67
Were we to apply the same approach to the analysis of the short-term price for gold and silver a record price would result for gold and a dramatic increase would be realized in the price of silver. Gold has gone up only 8% YTD vis-à-vis the S&P 500's 13.9% or 57.5% as much. Therefore, should the S&P 500 go up 40% one could expect, under this scenario, that gold would go up a further 23% (57.5% of 40%) which would put gold well above that 'precious barrier' of $1000 to a record $1175 by end of 2010. Again, the results of the comparative analysis seem achievable.
Silver is up 30.3% YTD or 2.2 times that of the S&P 500. That would translate into an 87% price increase in the current price of silver from $14.72 as of last Friday to $27.50 by the end of 2010. The resulting number seems a bit far-fetched but that is what the analysis reveals for what it is worth.
Relationship Suggests the Micro/Nano-cap Category Could Set Record High
The CDNX is the proxy for the micro/nano-cap category of stocks and it is up 67% YTD in U.S. dollars. As such, if the micro/nano category were to continue to outperform the S&P 500 by the same ratio for the balance of the year the 40% increase in the S&P 500 would equate to a value of 3472 for the CDNX or 3% beyond the record high of 3370 reached in May 2007. The results of this comparative analysis seem possible on the surface but given the continuing tight credit situation such an advance in such a short period of time and at this particular point in time seems somewhat unlikely.
Relationship Suggests 33% of Warrants Would become Exercizable?
The above analyses suggests that, as the relationships currently stand between the S&P 500, the HUI and GDM indices, gold, silver and the micro/nano-cap category of stocks, were the S&P 500 to go up 40%, gold bullion might well go up 23%, large/medium cap gold and silver mining/royalty companies might go up by 60%, silver might go up as much as 87% and micro/nano-cap companies might go up by almost 200%. Since the 24-month plus duration warrants of commodity-related companies are up 75% more than their associated stocks, i.e. 112.3% vs. 64.2% YTD, according to information gleamed from preciousmetalswarrants.com's free database, one would expect such warrants to appreciate in excess of 300% if the relationship holds true. If that were to happen a third of the 100 or so commodity-related warrants trading in the market would become exercisable enabling owners of same to reap major over-and-above returns.
The Hong Kong-based Merrill Lynch Asia strategists concluded their August 26 analysis by explaining that a 40% melt-up rally in the U.S. may be triggered by central bankers keeping interest rates low (and there is no evidence to the contrary at this point in time), an economic recovery (which there seems to be if we are to believe even a fraction of the "green shoots" hype we have been hearing the past few weeks) or an undervalued dollar (which is debatable with many a convincing argument that the dollar is just the opposite and going to get much weaker).
Their analysis bears scrutiny and ongoing review for us to successfully navigate these troubled investment waters we all find ourselves currently in. It certainly would be nice to see the S&P 500 go up a further 40% in the next few months; gold and silver a further 23% and 87% respectively to set a base for even greater heights as the stock market crumbles; commodity-related large and medium-cap stocks a further 60%; micro and nano (penny) stocks go up 200% and a warrants with the right leverage/time values to go up in excess of 300%. Very nice indeed!
To my readers: I receive many emails with questions and comments regarding my articles and I make a point of replying to each and every one. Please feel free to drop me a line or two. If you are interested in writing an article we would be delighted in considering you as one of our periodic Guest Contributors. I am a guest speaker at the inaugural World MoneyShow in Toronto this coming October 22/23. If you attend please introduce yourself.
Lorimer Wilson (lorimer.wilson@live.com) is Director of Marketing and Contributing Editor of:
- www.PreciousMetalsWarrants.com which provides an online subscription database for all warrants trading on mining and other natural resource companies in the United States and Canada and offers a free weekly email and
- www.InsidersInsights.com which alerts subscribers when corporate insiders of a limited number of junior mining and natural resource companies are buying and selling.
© 2009 Copyright Lorimer Wilson- All Rights Reserved
Disclaimer: The above is a matter of opinion provided for general information purposes only and is not intended as investment advice. Information and analysis above are derived from sources and utilising methods believed to be reliable, but we cannot accept responsibility for any losses you may incur as a result of this analysis. Individuals should consult with their personal financial advisors.
Lorimer Wilson Archive |
© 2005-2022 http://www.MarketOracle.co.uk - The Market Oracle is a FREE Daily Financial Markets Analysis & Forecasting online publication.
Comments
|
Nadeem_Walayat
01 Sep 09, 22:46 |
Pretcher / Dent precise calls
Hi Lorimer It would be useful to indicate where the authors, dent / prechter said a year earlier that stocks would rise, from mid 2009 to mid 2010 i.e. quotes / links to. The only thing I am aware of is Pretcher in late feb 09 call of covering shorts and a spike higher but nothing to imply a 1 year bull market, rather he remained fixed to his bear market outlook. - http://www.marketoracle.co.uk/Article9153.html Best Nadeem Walayat, |
|
Michael Montalto
13 Apr 10, 07:47 |
Wow, you're out of your mind
1400 - 400 Wow, if ever there was someone using numbers and charts in order to sell themselves and their readers on nonsense, this is it! Thanks for the laugh. S&P 400...do you have ANY idea what it would take in order for the market to actually get to that level? LOL |
|
Tony
22 May 10, 21:31 |
Looks like the scenario is playing out
Gold at 1177. Stocks up by 40% then crashing. Nice analysis. |
|
RM
30 Jun 10, 00:35 |
Reached the Peak?
Death Cross: DJIA 50MA crosses 100MA, 200MA scheduled to cross next week. (wrong index, but parallel for debate sake) Decline play out over the next 2-3 years places index bottoming around mid-year 2013. Just in time for a mid-decade rally before the next slump. Lord help us |


