History Repeating Towards Dollar, Bonds and Stocks Crashing in Unison
Stock-Markets / Financial Crash Aug 31, 2009 - 11:56 AM GMTBy: Captain_Hook
 Many are now talking about how the markets appear to be managed these days, and these people are now taking conspiracy theories in this regard far more seriously. And without a doubt the Fed and Treasury are working overtime to keep the bubbles afloat, the bubbles in both equities and debt. The key in this regard for now is keeping interest rates low, however this will not be enough forever if revenues keep shrinking in the face of rising costs. Sooner or later, foreigners will see the US has no hope of honoring it’s debts short of hyperinflation and continued acceleration in monitization efforts (particularly in debt markets), and will begin pulling sufficient assets out of American markets to send market interest rates past the margin consumers can handle.
The following is an excerpt from commentary that originally appeared at Treasure Chests for the benefit of subscribers on Tuesday, August 18th, 2009.
This will collapse consumer credit demand further, and in doing so, pass along deflation in the demand for goods, services, revenues, and asset prices. Like dominos, one by one, all facets of the economy will contract / fall, which will bring about a funk that will make the Japanese experience of the last 20-years look like a walk in the park. This is because the entire globe will be caught in a period of readjustment and decentralization away from the American Empire, which will affect business models and living standards around the world. Historically, periods like this have caused war as economies crumble. Lets all hope this can be avoided in the here and now.
The first sign process is accelerating in this respect will be when the US Dollar ($) falls but asset prices do not respond favorably. Yesterday the $ (and Treasuries) rallied while equities fell hard, however it could not close above 80, suggestive the trend lower is still alive on an intermediate-term basis. A rising $ and falling asset prices would really hurt right now with the economy continuing to contract, so you can count on every effort to be made to keep it below 80. Correspondingly then, a multi-day close above the previous high at 79.66 and the 50-day moving average would be very telling, suggestive the second larger degree wave down in stocks (all equities) was underway, with the test and possible failures at the March lows in the making.
Such an outcome would be at odds with the post crash analog of the Nikki, ushering in the likelihood of the post election pattern becoming dominant. You will know this is so when the $ breaks higher, as per above. Until then, and because the $ is counting lower in five-wave affairs, the possible dominance of the post crash Nikki pattern dominating is still alive, where it’s possible the $ breaks higher but fails. This would keep the $ and equities consolidating right through October, while the post election pattern calls for significant weakness in equities beginning in September. So, we will likely need wait until next month to see how all this resolves, with stocks (equities) essentially moving sideways until then.
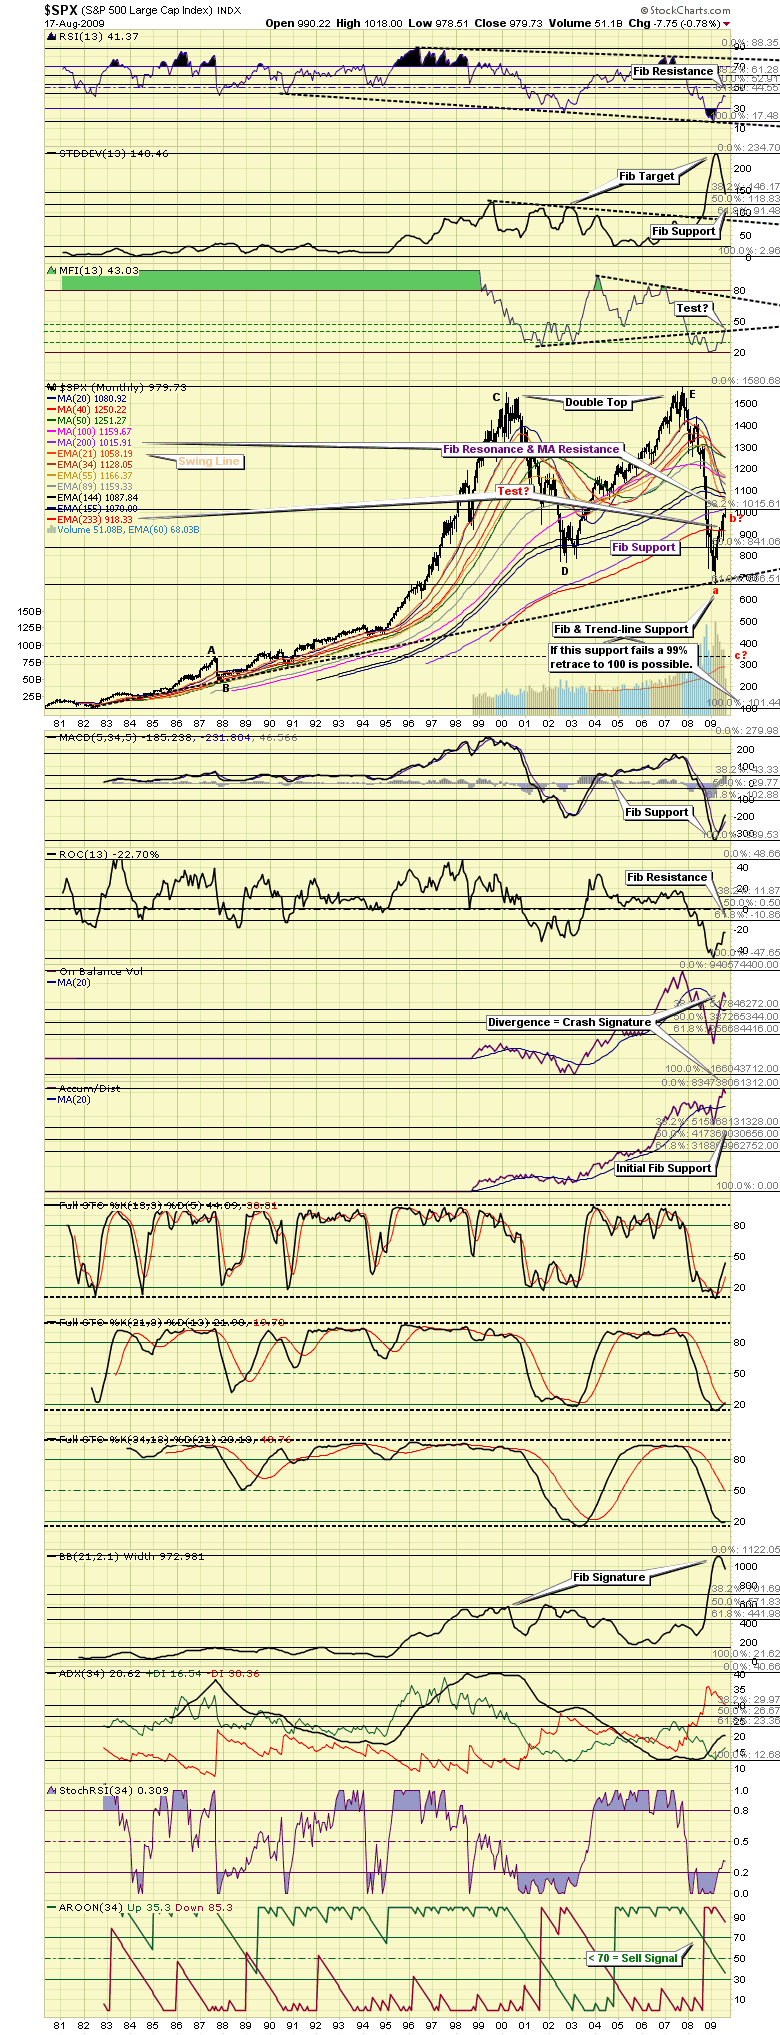
If the $ does break higher next month, and stocks correspondingly lower, key supports on the major averages would then come into play. In looking at a monthly chart of the S&P 500 (SPX) in defining these levels, the first of significance brings us right back to the all important Fibonacci 233-exponential moving average (EMA), currently at 918 and change. This is ‘last ditch support’ for the bulls past Fibonacci and trend-line support in the 700 area. Of course like Fibonacci resonance resistance at recent highs stopped the rally, corresponding support along the way at 840 would likely provide temporary support, however I would be very surprised if the March lows are not tested before its all over, with failure not out of the question (likely in fact) considering we are dealing with a very high level (the highest short of species extinction) move here. (See Figure 1)
Figure 1

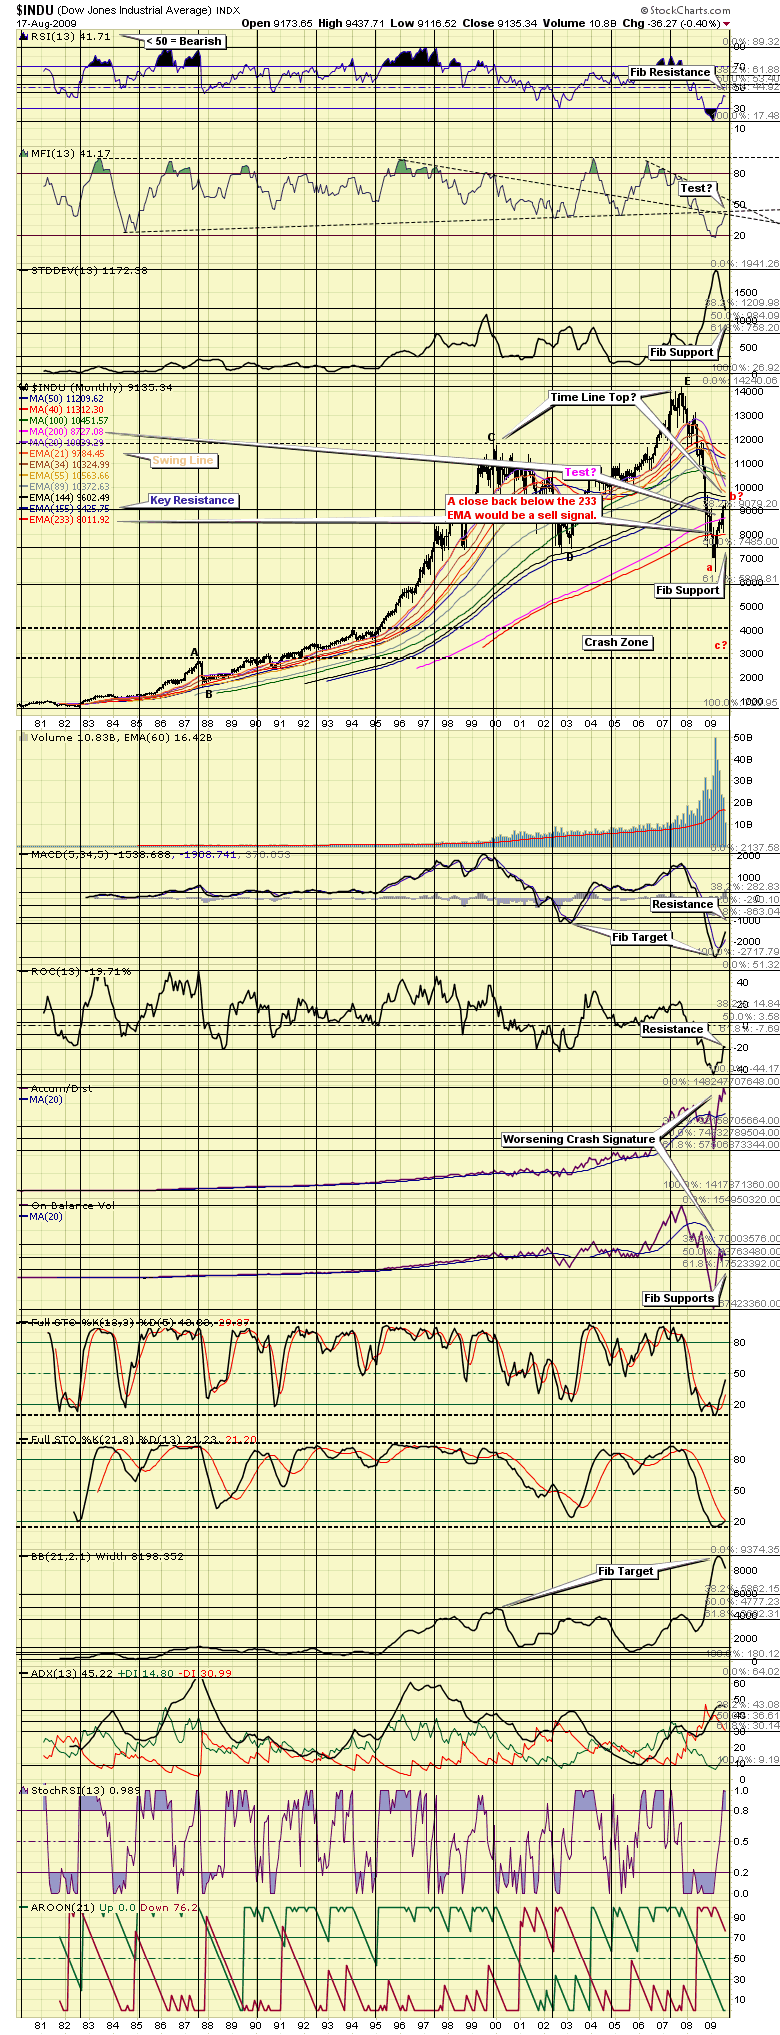
And the story is basically the same when looking at the Dow, with the exception it was the 155-EMA (a number in nature) that stopped the rally, not the simple 200-month moving average (man defined) as with the SPX, making support / resistance metrics on this plot very important indeed. So, although we are ultimately looking to see if the 233-EMA holds on both the SPX and Dow plots, one may wish to give the Dow greater deference considering the movements are more profound, not to mention a breakdown would be signaled earlier with support now at 8,000, the large round number. Once this support fails, then the possibility of a trip down to the crash zone comes into play. (See Figure 2)
Figure 2
This is when the $, bonds, and equities would be crashing in unison, with precious metals making the proverbial moon-shot as panicky investors endeavor to secure the last vestiges of their wealth (borrowing from Rodney Dangerfield in the movie Caddy Shack) in something more secure than a popcorn fart. In this respect it’s important to realize fiat currency systems ultimately become increasingly destabilized and collapse when the debt loop (debasement extremes) gets out of hand. We are there now, just waiting for real estate based credit to roll over in the States, once this happens, retirement dreams and lifestyles will go flying out the window with peoples portfolios.
Unfortunately we cannot carry on past this point, as the remainder of this analysis is reserved for our subscribers. Of course if the above is the kind of analysis you are looking for this is easily remedied by visiting our continually improved web site to discover more about how our service can help you in not only this regard, but also in achieving your financial goals. For your information, our newly reconstructed site includes such improvements as automated subscriptions, improvements to trend identifying / professionally annotated charts, to the more detailed quote pages exclusively designed for independent investors who like to stay on top of things. Here, in addition to improving our advisory service, our aim is to also provide a resource center, one where you have access to well presented 'key' information concerning the markets we cover.
And if you have any questions, comments, or criticisms regarding the above, please feel free to drop us a line. We very much enjoy hearing from you on these matters.
Good investing all.
By Captain Hook
http://www.treasurechestsinfo.com/
Treasure Chests is a market timing service specializing in value-based position trading in the precious metals and equity markets with an orientation geared to identifying intermediate-term swing trading opportunities. Specific opportunities are identified utilizing a combination of fundamental, technical, and inter-market analysis. This style of investing has proven very successful for wealthy and sophisticated investors, as it reduces risk and enhances returns when the methodology is applied effectively. Those interested in discovering more about how the strategies described above can enhance your wealth should visit our web site at Treasure Chests
Disclaimer: The above is a matter of opinion and is not intended as investment advice. Information and analysis above are derived from sources and utilizing methods believed reliable, but we cannot accept responsibility for any trading losses you may incur as a result of this analysis. Comments within the text should not be construed as specific recommendations to buy or sell securities. Individuals should consult with their broker and personal financial advisors before engaging in any trading activities, as we are not registered brokers or advisors. Certain statements included herein may constitute "forward-looking statements" with the meaning of certain securities legislative measures. Such forward-looking statements involve known and unknown risks, uncertainties and other factors that may cause the actual results, performance or achievements of the above mentioned companies, and / or industry results, to be materially different from any future results, performance or achievements expressed or implied by such forward-looking statements. Do your own due diligence.
Copyright © 2009 treasurechests.info Inc. All rights reserved.
Unless otherwise indicated, all materials on these pages are copyrighted by treasurechests.info Inc. No part of these pages, either text or image may be used for any purpose other than personal use. Therefore, reproduction, modification, storage in a retrieval system or retransmission, in any form or by any means, electronic, mechanical or otherwise, for reasons other than personal use, is strictly prohibited without prior written permission.
Captain Hook Archive |
© 2005-2022 http://www.MarketOracle.co.uk - The Market Oracle is a FREE Daily Financial Markets Analysis & Forecasting online publication.


