Stock Market System Neutral with Bearish Bias
Stock-Markets / Stock Index Trading Aug 31, 2009 - 08:55 AM GMTBy: Angelo_Campione
 The system remains on a Neutral signal (with a bearish bias).
Just as day is followed by night, so too will the current enthusiasm be followed by a decline (and probably within the next few weeks). Apart from September being a traditionally weak period, there are growing signs that the market is unable to sustain its upward movement.
Part of the issue has been that people have felt that the market should be dropping and so true to form the market does the opposite. We find ourselves now in a market that's looking to convince as many as possible that "this time it's different".
When the fear of missing out rises enough within people that has them start buying again, that's when the plug will be pulled and we get the flush that is necessary to have a healthy market.
The interesting thing now is that the Nasdaq hasn't been as strong as the general market and when you consider that the Nasdaq has been leading the market for most of the year, this is significant.
I don't know the exact timing of when the drop will begin, but when the music does finally stop, everyone's likely to want to go home quickly!
The week ahead looks uncertain, either we grind a little higher or we begin the drop.
On to the analysis..
SPX Chart - Bigger Picture

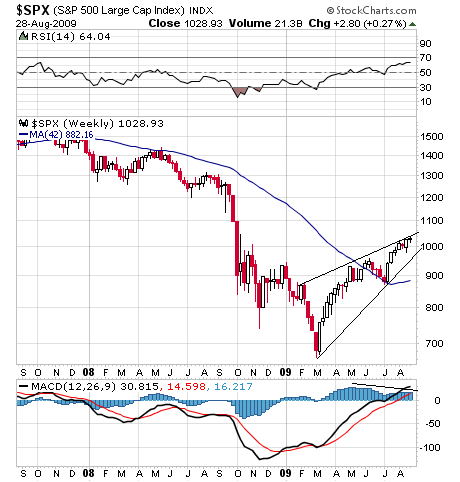
The bigger picture continues to track the bearish rising wedge. Each week rattles the bears into frustration as the market continues to nudge higher. It seems to be just a matter of time before enough frustrated bears turn bullish and then the move lower will be assured.
Being patient during these times is not easy as no one likes to leave money on the table but dealing with emotions is the best gift that trading the markets brings.
For now, the MACD histogram is showing that the latest move is suspect but the linear MACD is still positive. It could still take around a month to finally get a decent breather in this run up, but it is coming.
SPX Chart - Shorter Picture

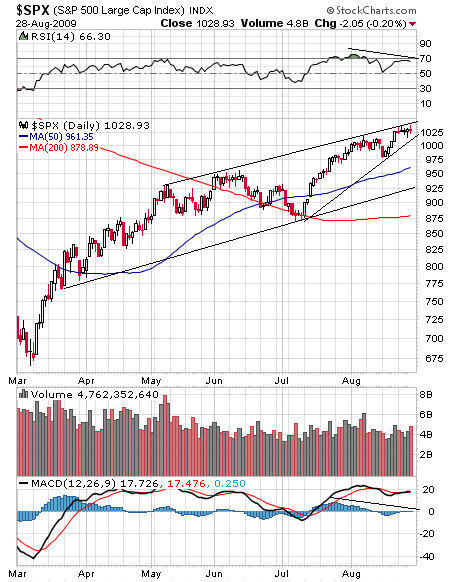
I've shown a trend channel for the shorter term that shows how we're tracking the upper band of the channel at the moment. There's also a tighter rising bearish wedge that looks as though it could break within the next week or two.
If this wedge breaks we could go down to 930 but support between 960 and 980 is likely to hold as this area is support from the bigger picture chart.
Note how both the RSI and MACD are now showing negative divergences, we're getting close but don't be surprised if we get a few more up days still.
For the week ahead, support on the SPX is 1015 and resistance is at 1040 - 1050.
The VIX Picture

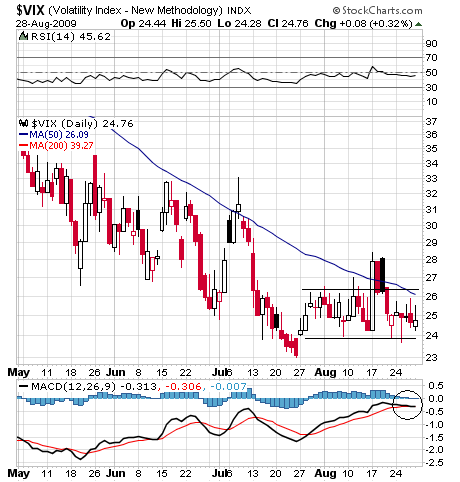
The VIX has essential gone to sleep this past week and is stuck in a range between about 24 and 26.
The MACD has flat lined and could go either way from here, we could key point right now. If the linear MACD can get about zero, the down phase in the markets is likely to begin, on the other hand if the MACD starts a new down leg, the markets will continue to push higher.
The VIX measures the premiums investors are willing to pay for option contracts and is essentially a measure of fear i.e. the higher the VIX, the higher the fear in the market place. It tends to move inversely with the markets.
Current Position:

The current position from August 24 is a full position in an SPX September 1110/1120 Call Option Spread for a net credit of $0.50.
The premium received if you entered this trade is $50 per $1,000 of margin required per spread (before commissions).
With 3 weeks to go until expiry and an 80 point buffer we remain comfortable with this position.
Current Performance for 2009:
(Please note, this performance is in percent and raw, i.e. without brokerage/commissions taken into account)
Quote of the Week:
The quote this week is from Jean Jacques Rousseau, "Man is born free and everywhere he is in chains. One thinks himself the master of others and still remains a greater slave than they."
Feel free to email me at angelo@stockbarometer.com if you have any questions or comments.
If you are receiving these alerts on a free trial, you have access to all of our previous articles and recommendations by clicking here. If you do not recall your username and/or password, please email us at customersupport@stockbarometer.com. If you are interested in continuing to receive our service after your free trial, please click here.
By Angelo Campione
Important Disclosure
Futures, Options, Mutual Fund, ETF and Equity trading have large potential rewards, but also large potential risk. You must be aware of the risks and be willing to accept them in order to invest in these markets. Don't trade with money you can't afford to lose. This is neither a solicitation nor an offer to buy/sell Futures, Options, Mutual Funds or Equities. No representation is being made that any account will or is likely to achieve profits or losses similar to those discussed on this Web site. The past performance of any trading system or methodology is not necessarily indicative of future results.
Performance results are hypothetical. Hypothetical or simulated performance results have certain inherent limitations. Unlike an actual performance record, simulated results do not represent actual trading. Also, since the trades have not actually been executed, the results may have under- or over-compensated for the impact, if any, of certain market factors, such as a lack of liquidity. Simulated trading programs in general are also subject to the fact that they are designed with the benefit of hindsight. No representation is being made that any account will or is likely to achieve profits or losses similar to those shown.
Investment Research Group and all individuals affiliated with Investment Research Group assume no responsibilities for your trading and investment results.
Investment Research Group (IRG), as a publisher of a financial newsletter of general and regular circulation, cannot tender individual investment advice. Only a registered broker or investment adviser may advise you individually on the suitability and performance of your portfolio or specific investments.
In making any investment decision, you will rely solely on your own review and examination of the fact and records relating to such investments. Past performance of our recommendations is not an indication of future performance. The publisher shall have no liability of whatever nature in respect of any claims, damages, loss, or expense arising out of or in connection with the reliance by you on the contents of our Web site, any promotion, published material, alert, or update.
For a complete understanding of the risks associated with trading, see our Risk Disclosure.
© 2009 Copyright Angelo Campione - All Rights Reserved
Disclaimer: The above is a matter of opinion provided for general information purposes only and is not intended as investment advice. Information and analysis above are derived from sources and utilising methods believed to be reliable, but we cannot accept responsibility for any losses you may incur as a result of this analysis. Individuals should consult with their personal financial advisors.
© 2005-2022 http://www.MarketOracle.co.uk - The Market Oracle is a FREE Daily Financial Markets Analysis & Forecasting online publication.


