Stock Market, No Selling Yet
Stock-Markets / Stock Index Trading Aug 30, 2009 - 12:30 PM GMTBy: Jay_DeVincentis
 No Selling Yet
The market is holding up well, which weighs into our call.
SOS Timing Indicator
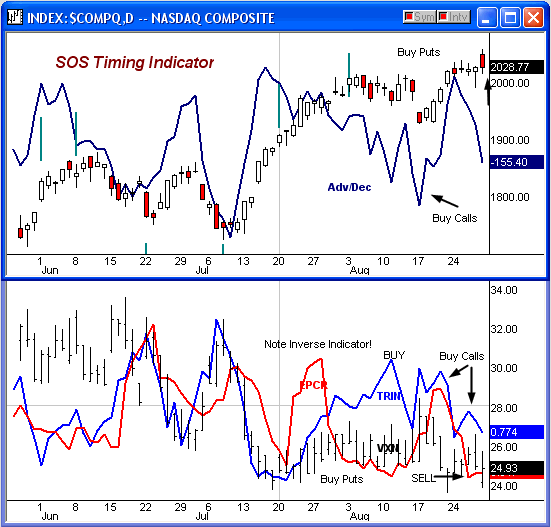
The timing indicator is mixed here. And the markets tried to sell off on Thursday but reversed. The gap up close lower on Friday may still be bullish, since the depth of the retracement merely closed the gap set Friday morning. The EPCR is a little complacent. And the TRIN is moving in the direction of bullishness. The VXN is breaking lows, so while it looks like it’s at support, it’s also trending lower, which is bullish.
In the top pance, the advance decline line has pulled back nicely during this sideways move. That suggests we have some more room to run on the upside. Some of my cycle work calls for tops around 9/14 and 9/21...
Stock Options Speculator uses the above indicator in the establishing of various options trades and strategies. The indicator has two frames. The top frame shows the Nasdaq Composite and the Nasdaq Advances and Declines. The lower frame shows volatility (candles), the equity put call ratio (red line) and the Trading Index (blue line). The height of the indicators determines if call or put buying strategies are recommended.
Options Trading Ideas
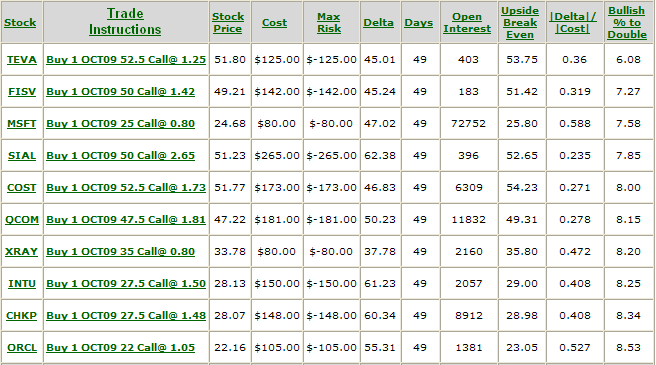
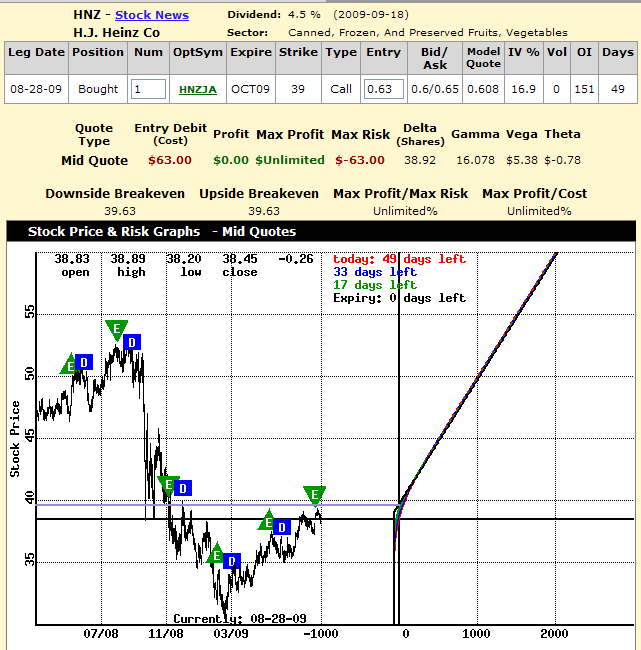
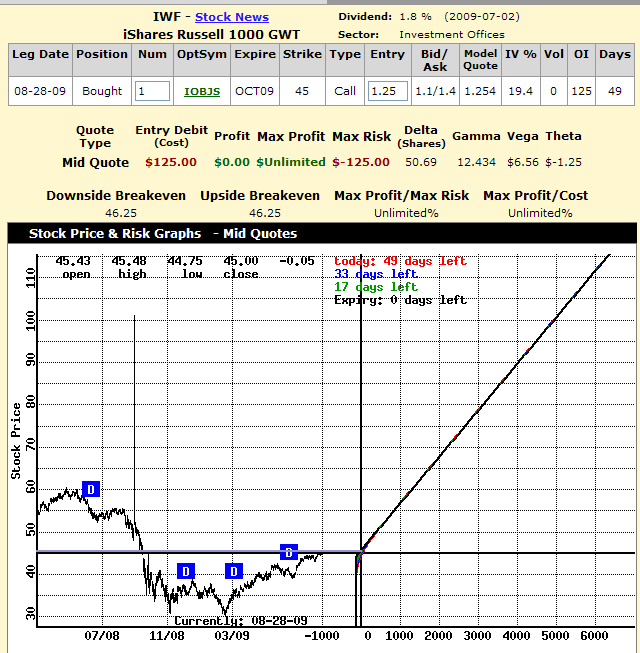
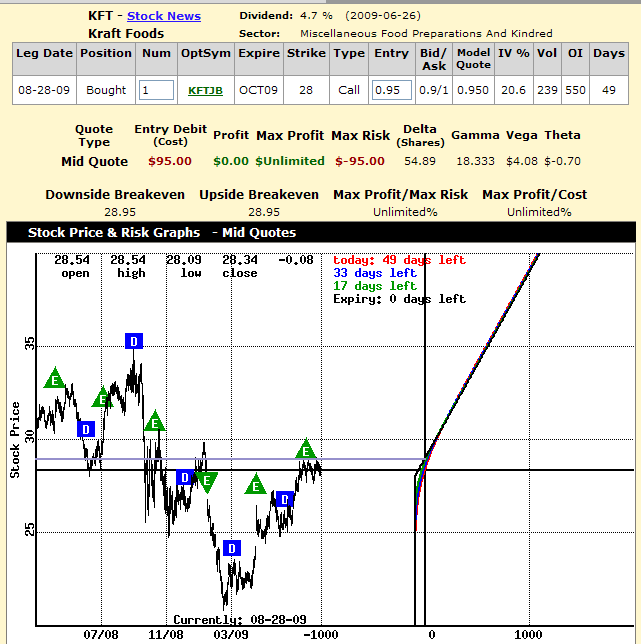
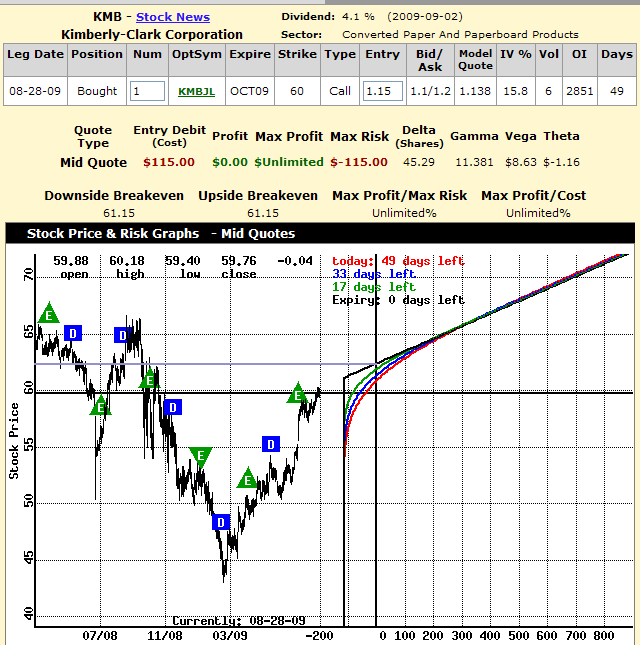
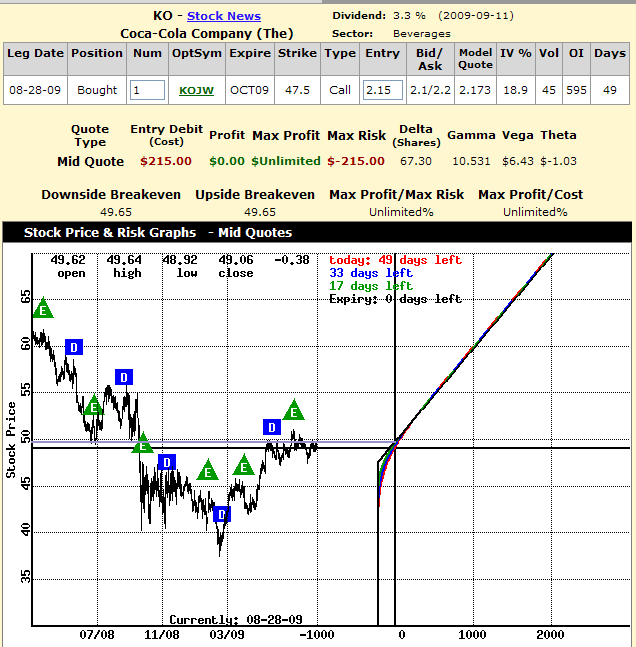
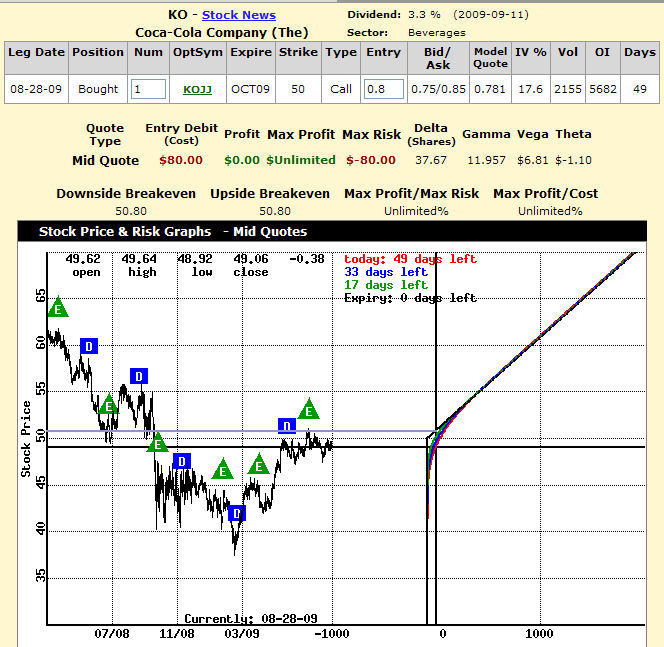
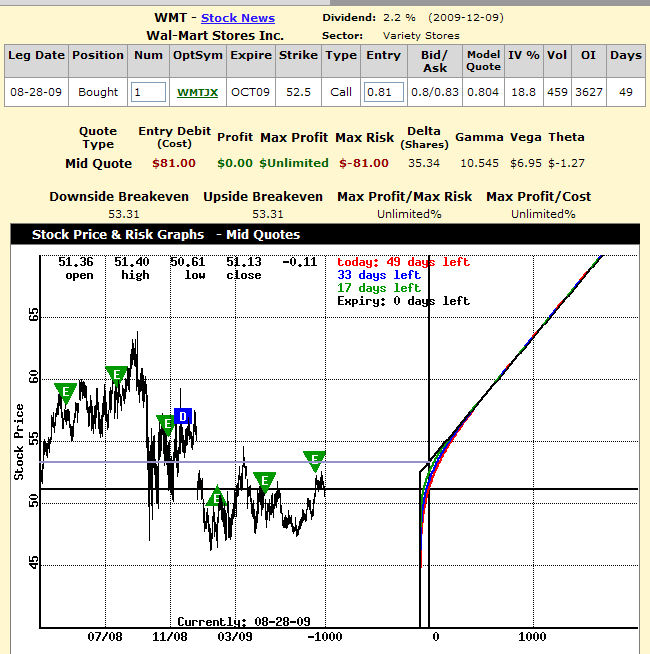
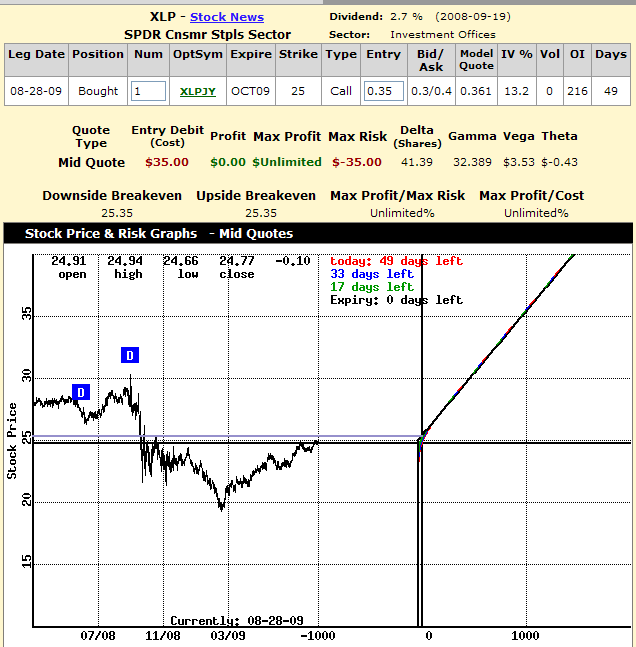
Based on the SOS Timing Indicator or other special market conditions, the above 10 trades are recommended for consideration in your trading plan.
Risk Graphs
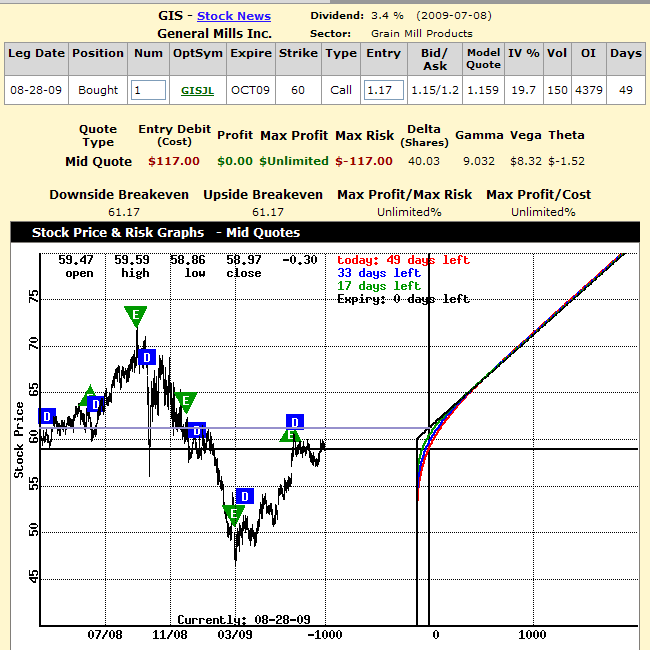
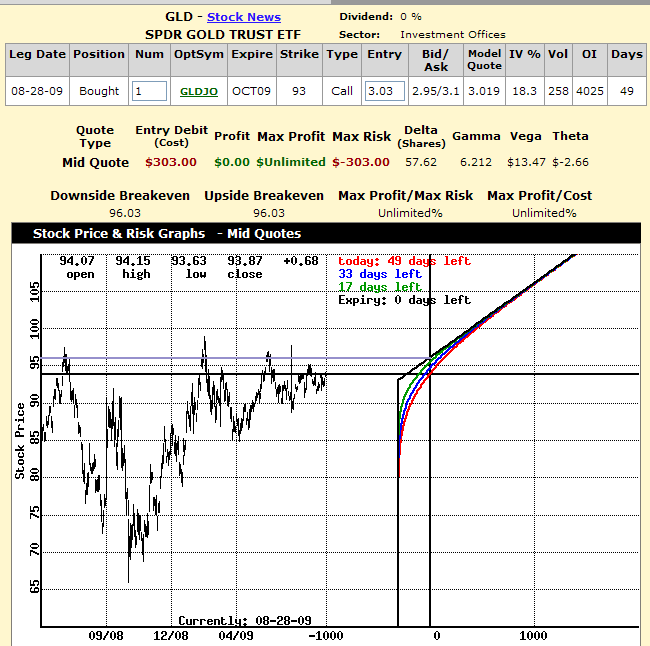
The following risk graphs show stock price plotted against potential profitability. They're listed alphabetically.
Closing Bell
Well, the market hasn’t done much of anything of late, we continue to position for moves higher and lower as that’s what we do. You never know when the market will break in one direction or the other, you just have to continue to position for the most likely move, with some consideration towards magnitude. But since we position weekly, magnitude is limited.
These searches usually give us the most fairly priced options, which means they have a low implied volatility - seeing that if they start to move, IV will rise as well, contributing to the gains of the position. They are also ranked by the lowest price movement relative to increase in option pricing. Point is, the Nasdaq 100 optionable stocks will tend to have slightly higher volatility - so here’s that list and it’s worth considering:

Regards,
If you have any questions or comments, email me at Jay@stockbarometer.com.Regards,
By Jay DeVincentis
Stock Barometer Premier Membership Receive 5 Newsletters, including the Daily Stock Barometer, Stock Options Speculator, QQQQ/Rydex Trader, Market Chat & Explosive Stock Alert FOR ONE LOW PRICE.
Important Disclosure
Futures, Options, Mutual Fund, ETF and Equity trading have large potential rewards, but also large potential risk. You must be aware of the risks and be willing to accept them in order to invest in these markets. Don't trade with money you can't afford to lose. This is neither a solicitation nor an offer to buy/sell Futures, Options, Mutual Funds or Equities. No representation is being made that any account will or is likely to achieve profits or losses similar to those discussed on this Web site. The past performance of any trading system or methodology is not necessarily indicative of future results.
Performance results are hypothetical. Hypothetical or simulated performance results have certain inherent limitations. Unlike an actual performance record, simulated results do not represent actual trading. Also, since the trades have not actually been executed, the results may have under- or over-compensated for the impact, if any, of certain market factors, such as a lack of liquidity. Simulated trading programs in general are also subject to the fact that they are designed with the benefit of hindsight. No representation is being made that any account will or is likely to achieve profits or losses similar to those shown.
Investment Research Group and all individuals affiliated with Investment Research Group assume no responsibilities for your trading and investment results.
Investment Research Group (IRG), as a publisher of a financial newsletter of general and regular circulation, cannot tender individual investment advice. Only a registered broker or investment adviser may advise you individually on the suitability and performance of your portfolio or specific investments.
In making any investment decision, you will rely solely on your own review and examination of the fact and records relating to such investments. Past performance of our recommendations is not an indication of future performance. The publisher shall have no liability of whatever nature in respect of any claims, damages, loss, or expense arising out of or in connection with the reliance by you on the contents of our Web site, any promotion, published material, alert, or update.
For a complete understanding of the risks associated with trading, see our Risk Disclosure.
© 2009 Copyright Jay DeVincentis - All Rights Reserved
Disclaimer: The above is a matter of opinion provided for general information purposes only and is not intended as investment advice. Information and analysis above are derived from sources and utilising methods believed to be reliable, but we cannot accept responsibility for any losses you may incur as a result of this analysis. Individuals should consult with their personal financial advisors.
© 2005-2022 http://www.MarketOracle.co.uk - The Market Oracle is a FREE Daily Financial Markets Analysis & Forecasting online publication.


